
This Week in Earnings – Q1'26
Consumer Discretionary & Staples Sector Beat
Our thought leadership this week addresses:
- Key Events this week
- Earnings Snap, covering the S&P 500 stats to date
- Spotlight on Consumer Discretionary & Staples in The Sector Beat
Tariff Spotlight, including key focus areas, Q&A themes, and guidance
Key Events
FOMC Meeting
- The FOMC left the federal funds target rate unchanged at 3.50%-3.75%, citing solid economic activity, low average job gains, stable employment, and elevated inflation partly tied to higher global energy prices. The last FOMC decision of the Powell era was unusually divisive. Four of the committee’s 12 voting members dissented, the highest number since October 1992. Stephen Miran was the sole member voting for a 25 bps cut. At the same time, Beth Hammack, Neel Kashkari, and Lorie Logan supported holding rates at existing levels but opposed including an easing bias in the statement. During the press conference, Jerome Powell confirmed that this was his final press conference and that he would remain governor for an indefinite period after his tenure as chair concludes. (Source: Federal Reserve Board, WSJ, CNBC, Bloomberg, Reuters)
U.S. GDP
- Headline GDP increased at a 2.0% annualized rate versus expectations for 2.2% during Q1’26. Despite the miss, this marks an improvement from the prior quarter’s print of 0.5% growth, as each additive component notched increases. Growth in investments reflected increases in equipment, intellectual property, and private inventory investment. Within equipment, the increase was driven by growth in information processing equipment, notably computers and peripherals, painting a broadly supportive picture of ongoing demand for AI-related capex spending. (Source: U.S. Bureau of Economic Analysis, WSJ, CNBC)
PCE Index and Personal Income / Spending
- The Fed’s preferred inflation gauge rose to 3.5% in March, the highest reported rate in nearly three years and materially above the Fed’s stated target of 2.0%. Consumer spending increased $195.4B from the prior year, with nearly half of that, $81.3B, coming from gasoline and other energy goods. Real consumption remained positive as nominal income improved, but real disposable personal income declined by 0.1%, indicating that price growth more than offset the nominal income gain. (Source: U.S. Bureau of Economic Analysis, WSJ, CNBC, Bloomberg)
Durable Goods
- Headline March durable goods orders rose a seasonally adjusted 0.8%, or $2.6B, to $318, ending three straight months of negative prints. Much of the increase is attributable to higher defense orders. When excluding defense, new orders for all durable goods fell by 0.3% seasonally adjusted. New orders of defense aircraft and parts rose by 16.9% from the prior quarter, and new orders of defense capital goods saw a sequential increase of 18.0%. (Source: United States Census Bureau, WSJ)
Building Permits and Housing Starts
- March privately-owned housing units authorized by building permits in March fell to a seasonally adjusted annual rate of 1.372M, which is 10.8% lower than February levels and 7.4% lower than the year prior. This is in contrast to new housing starts, which rose 10.8% in March to a 15-month high. With permits serving as a leading indicator of future housing activity, the drop in permits likely reflects growing caution among builders to commit to new projects. (Source: United States Census Bureau, Department of Housing and Urban Development, National Association of Home Builders)
U.S. Trade Balance – Exports and Imports
- The advance goods trade deficit widened in March, increasing $4.4B from February to $87.9B. Exports rose $5.2B to $211.5B, but imports rose faster, increasing $9.6B. This is broadly supportive as stronger imports reflect resilient domestic demand, while higher exports signal growing competitiveness of U.S. producers and international business-cycle dynamics. Notably, exports of Industrial Supplies (including petroleum and petroleum products) is 32.2% higher than the prior year, while Capital Goods exports are 14.4% higher. (Source: United States Bureau of Economic Analysis, United States Census Bureau, Bloomberg)
Earnings Snap
63% of the S&P 500 has reported earnings to date
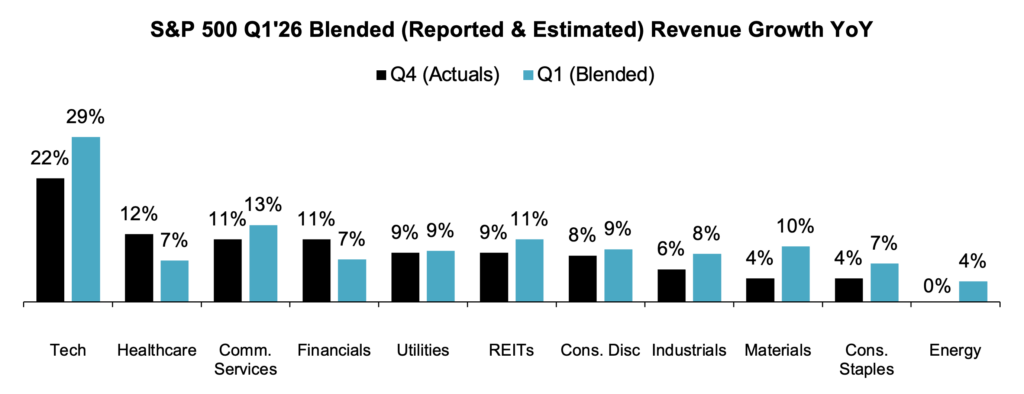
Q1'26 Revenue Performance
- 78% have reported a positive revenue surprise, above the 1- and 5-year averages of 73% and 70%, respectively
- Blended revenue growth (combines actual reported results for companies and estimated results for companies yet to report) is 11%
- Companies are reporting revenue 2% above consensus estimates, roughly equivalent to the 1-year and 5-year averages of 2%
Q1’26 EPS Performance
- 83% have reported a positive EPS surprise, above the 1- and 5-year averages of 78% each
- Blended earnings growth (combines actual reported results for companies and estimated results for companies yet to report) is 28%
- Companies are reporting earnings 12% above consensus estimates, well above the 1- and 5-year average of 7% each

The Sector Beat: Consumer Discretionary & Staples
Consumer Discretionary & Staples Guidance Trends
We analyzed annual revenue and EPS guidance for calendar-year Consumer Discretionary & Staples companies with market caps ≥$1B that have reported earnings to date.
For comparison purposes, we provide an “All Company” benchmark that tracks, in real time, a basket of calendar-year companies ≥$1B in market cap across all sectors that have reported earnings to date (n = 311).1
1. As of 4/30/2026
Consumer Discretionary Guidance Breakdown by Industry
| Industry | Number of Companies |
|---|---|
| Automobile Components | 4 |
| Diversified Consumer Services | 4 |
| Leisure Products | 3 |
| Hotels, Restaurants, and Leisure | 3 |
| Specialty Retail | 3 |
| Household Durables | 2 |
| Textiles, Apparel, and Luxury Goods | 2 |
| Distributors | 1 |
| Total | 22 |
Source: Corbin Advisors
Consumer Staples Guidance Breakdown by Industry
| Industry | Number of Companies |
|---|---|
| Food Products | 6 |
| Beverages | 5 |
| Distribution & Retail | 3 |
| Household Products | 2 |
| Tobacco | 2 |
| Total | 18 |
Source: Corbin Advisors
Revenue Guidance
Across both Discretionary and Staples, Consumer companies have largely Maintained annual revenue guidance, generally in line with the All Company benchmark.
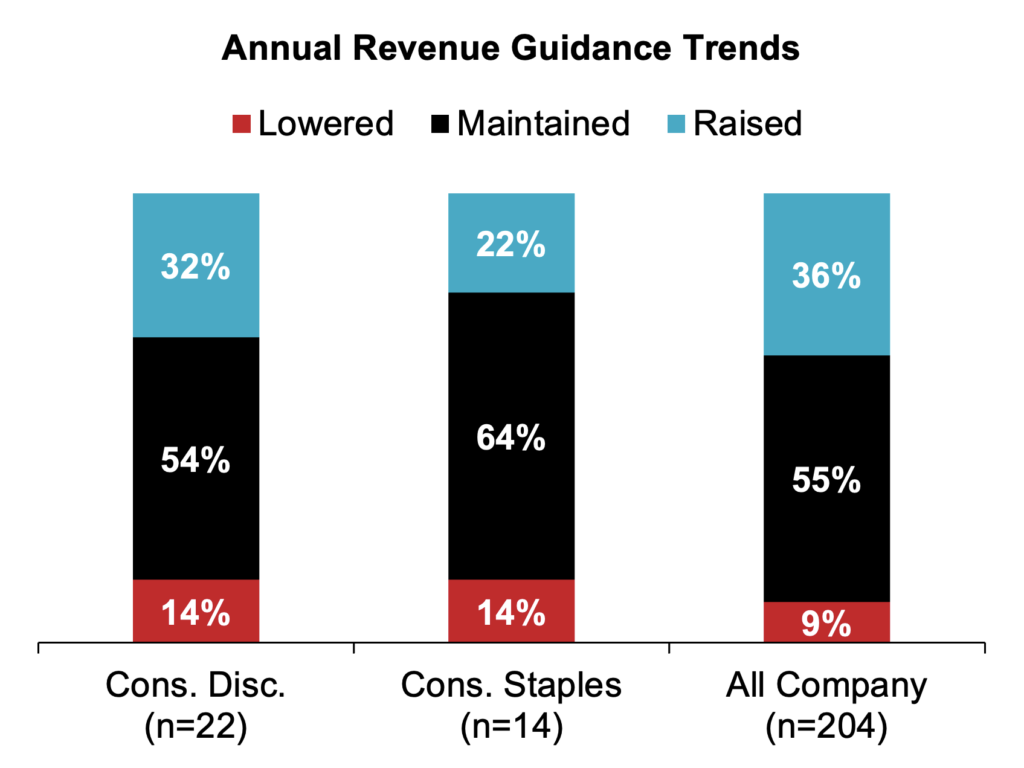
Overall, Consumer companies that Lowered guidance: (n = 5)
- Average midpoint:
- Overall: -1.1% growth versus 4.3% last quarter
- Consumer Disc. (n = 3): 1.5% growth versus 2.2% last quarter
- Consumer Staples (n = 2): -4.9% growth versus 7.5% last quarter
- Average Spread:
- Overall: Decreased 100 bps from last quarter to 2.2%
- Consumer Disc. (n = 3): Decreased 110 bps from last quarter to 2.1%
- Consumer Staples (n = 2): Decreased 80 bps from last quarter to 2.4%
Overall Consumer companies that Maintained guidance (n = 21)
- Average midpoint:
- Overall: 6.2% growth
- Consumer Disc. (n = 12): 3.4% growth
- Consumer Staples (n = 9): 4.2% growth (excl. outlier Keurig Dr Pepper2 – KDP)
- Average Spread:
- Overall: 2.8%
- Consumer Disc. (n = 12): 3.2%
- Consumer Staples (n = 10): 2.4%
Companies that Raised guidance (n = 10)
- 6 companies raised the top and bottom of the original range, 2 only raised the bottom, 1 only raised the top, and 1 raised the bottom but lowered the top (i.e., tightened range)
- Average midpoint:
- Overall: 9.4% growth versus 7.0% last quarter
- Consumer Disc. (n = 7): 9.9% growth versus 7.6% last quarter
- Consumer Staples (n = 3): 8.2% growth versus 5.7% last quarter
- Average spread:
- Overall: Decreased 40 bps from last quarter to 2.7%
- Consumer Disc. (n = 7): Decreased 40 bps from last quarter to 3.1%
- Consumer Staples: (n = 3): Decreased 50 bps from last quarter to 1.6%
2. Keurig Dr. Pepper excluded due to the significant revenue contribution from the recent acquisition of JDE Peet’s
EPS Guidance
A significantly higher percentage of Consumer Discretionary companies, 60%, have Raised guidance compared to Consumer Staples companies, and the All Company benchmark (43%). Half of Consumer Staples companies Maintained EPS guidance, slightly higher than the All Company benchmark of 46%. Notably, 25% of Consumer Staples Lowered EPS guidance, compared to just 5% of Consumer Discretionary and 11% of All Company benchmarks.

Companies that Lowered guidance (n = 4)
- Overall: 75% of the companies lowered the top and bottom of the original range; the remaining only lowered the top
- Overall: The average spread decreased from 2.3% to 1.9%
- Consumer Disc. (n = 1): The average spread increased from 2.2% to 2.3%
- Consumer Staples (n = 3): The average spread decreased from 2.4% to 1.4%
Companies that Maintained guidance (n = 13)
- Overall: Average spread of 4.7%
- Consumer Disc. (n = 7): Average spread of 5.9%
- Consumer Staples (n = 6): Average spread of 3.8%
Companies that Raised guidance (n = 15)
- Overall: Nearly all companies raised the top and bottom of the range; 2 companies raised the bottom, but left the top unchanged
- Overall: Average spread decreased from 6.0% to 5.4%
- Consumer Disc. (n = 12): Average spread decreased from 6.5% to 6.0%
- Consumer Staples (n = 3): Average spread decreased from 3.9% to 3.0%
Earnings Call Analysis
Across U.S. Consumer Discretionary and Consumer Staples companies, Q1’26 earnings commentary has been intentionally measured but with an underlying cautiously optimistic tone. Management teams are framing consumer demand as increasingly bifurcated, with inflationary pressures from the ongoing Iran War permeating every aspect of the consumer experience. This has resulted in a more selective domestic consumer, with companies highlighting strategies focused on affordability, digital engagement, and targeted promotions to sustain volume. Staples companies are generally framing demand as more resilient, not robust, citing product breadth and recurring consumption. In contrast, Consumer Discretionary companies express the most caution, highlighting elevated interest rates, higher household costs driven by rising oil prices, and uneven consumer confidence. Notably, despite this, a subset of Consumer Discretionary raised full-year EPS guidance, as management teams highlighted below-the-line support from share repurchases and tariff-related refunds, as well as cost optimization and restructuring, rather than accelerating demand.
The Street, meanwhile, focused much less on reported earnings beats and more on the durability and trajectory of company performance, a consistent theme throughout the Q1’26 reporting season. Analysts were keen to better understand whether demand improvements were structural or timing-related; how much cost inflation from tariffs and the Iran War is embedded in guidance; and whether any price increases put volumes at risk. Unsurprisingly, Automotive OEMs faced some of the most pointed questions about tariffs, as analysts sought to unpack how costs were treated, USMCA exposure, and when refunds would be issued.
To that end, tariffs remain a persistent topic on earnings calls. Management teams framed tariffs as a material source of uncertainty, but one they are actively working to manage through clear mitigation plans. Common, yet effective strategies remain centered around sourcing flexibility, supplier negotiations, selective pricing, and productivity initiatives.
Additionally, tariff refunds are beginning to be addressed, but companies have been careful to distinguish between submitting a refund for processing and receiving an approved refund with a specified dollar amount. Executives, when pressed by analysts about forward guidance, have explicitly stated whether tariff refunds are included in guidance. Most companies have elected to exclude assumptions regarding tariff refunds from their guidance, but those that have (notably General Motors) have distinguished between tariffs paid under IEEPA and those paid under Section 232. Only IEEPA-based tariffs were found to be unlawful, with Section 232 applying broadly to imports that are of national importance.
Continuing, some companies have sized the expected impact of the conflict in the Middle East and are explicitly embedding those expectations into guidance. So far, this appears to be the exception rather than the rule, as the companies opting to include have been Consumer Discretionary companies with material exposure in the region.
Finally, AI continues to be a leading subject on earnings calls, with management teams increasingly discussing its use as an execution and productivity tool. The more advanced adopters are positioning their companies’ AI implementation explicitly, directly linking to product experience, customer engagement, revenue opportunities, and other quantifiable real-world outcomes. While messaging has become more disciplined since AI first entered the corporate zeitgeist, the Street remains focused on measurable ROI and the timing of returns rather than on early experimentation or vague generalizations about adoption practices.
Key Themes
Macro & Consumer
Dynamic Market Reinforces Bifurcation with Increased Pressure at the Bottom of the K; Companies Reinforce Consumer Value Proposition and Experience as Well as Promotional Strategies
- Domino’s Pizza ($1.7B, Hotels, Restaurants & Leisure): “Starting in March, we saw significant macro and competitive pressures weigh on the business. Looking back at Q1, pressure intensified throughout the quarter, in particular in March, because of growing consumer uncertainty. Consumer sentiment hit COVID level lows, and ongoing inflation continued to impact purchase decisions.”
- Yum Brands ($44.3B, Hotels, Restaurants & Leisure): “As I look at the US macro landscape and the US consumer, I have to look at it through the lens of our business…the consumer has faced various pressures across markets for several years now. And we continue to prove that when you deliver what consumers want and need, you can win with those consumers.”
- PulteGroup ($24.3B, Household Durables): “Economic reports talk to the K-shaped economy and how lower and middle-income families are struggling much more than those in upper incomes. Housing demand over the past two years has been consistent with these dynamics.We saw this play out again in our Q1 results, with both relative demand strength in our move-up and active-adult businesses and option-and-lot premium spend that continues to average over $100,000 per home. However, on the lower leg of the K, first-time buyers continue to struggle with the challenges of stretched affordability and fear of job loss.”
- eBay ($43.9B, Broadline Retail): “We continue to see a dynamic global macro environment with a divergence between the US and international. In the US, consumer demand for our business remains resilient so far despite volatility in trade policy and geopolitics.And strength was really broad-based across the board in Q1, including collectibles, Motors, and fashion. I would say it’s a different story in Europe, where it’s more challenging, as reflected in the consumer confidence and some of the macro data.”
- Coca-Cola ($329.8B, Beverages): “During the quarter, the external environment differed greatly across our Market. While many consumers remain resilient, others are under pressure due to persistent inflation, greater macroeconomic uncertainty, and volatility driven by the conflict in the Middle East.”
- Keurig Dr Pepper ($39.8B, Beverages): “With consumers seeking affordability in the current environment, we have refined our promotional strategies to offer compelling price points in key channels while maintaining discipline to ensure net price realization continues to offset inflationary pressures.”
- Procter & Gamble ($344.4B, Household Products): “There is a natural tension in these situations. You have broad macro cost headwinds hitting everyone in the industry, which are generally driving up Then, on the other side, you have the reality that the consumer has been hit with cumulative inflation beyond anything that they’ve seen in recent history. Consumers do respond well if we give them a truly better proposition in the categories that we’re in because they see there is upside. There is still upside in many of our products to make them better, deliver a better experience, and delight the consumer.”
Iran War
Most Highlight Accelerating Pressures from the Conflict; Hotel and Travel Companies See Direct Impact with Lower Bookings, While Global Restaurant Chains See Little Direct Disruption but Still Expect Second-derivative Headwinds
- Hilton Worldwide ($73.5B, Hotels, Resorts & Cruise Lines): “As we look ahead to Q2, we remain encouraged by a continuation of demand trends that we’ve been observing since late 2025 and now through April. But we do expect some headwinds related to the Middle East. As a result, for the full year, our systemwide RevPAR growth expectations are now 2% to 3%, factoring in a range of scenarios for the Middle East conflict and recovery.”
- Booking Holdings ($131.5B, Hotels, Resorts & Cruise Lines): “Despite the start of the Middle East conflict at the end of February, our teams delivered a quarter with strong execution and solid results. We booked 338 million room nights…representing 6% YoY growth. We estimate that the Middle East conflict impacted our room nights and gross bookings growth by ~2 percentage points, accounting for countries directly affected in the region, as well as bookers whose travel was affected by the conflict.”
- Procter & Gamble ($344.4B, Household Products): “Inflation across food, energy, healthcare, and many other areas of spending has taken a toll on consumers and how they assess value. Recent geopolitical events have elevated this to a new level of concern. In short, the consumer path to purchase is changing every day, and we expect an even more intense pace of change in the next three to five years. We are maintaining our fiscal 2026 guidance ranges across organic sales growth, core EPS, and adjusted FCF…however, where we will land within those ranges has become more uncertain given the geopolitical dynamics in the Middle East.”
- Crocs ($5.1B, Textiles, Apparel, & Luxury Goods): “I wanted to address the conflict in the Middle East as it relates to our business. As of today, it’s too early to fully quantify the impact… we see this affecting Crocs in three ways. One, the reduction of revenues from our Middle East distributor business, which is being contemplated within our annual guidance. Two, increase raw material and transportation costs associated with elevated oil prices. And three, a broader impact on the global macro economy, which is uncertain at this time.”
Tariff Impact
Companies Beginning to Submit Tariff Refunds but Prudently Exclude from Forward-looking Guidance; Some Including Impact of One-time IEEPA Benefit
- Procter & Gamble ($344.4B, Household Products): “Tariff refund, look, we are following the process the US administration is beginning to lay out. Once that process is clear, defined, and accessible, we will follow it. We have about $150 million after tax in refunds available from the IEEPA tariff. How much of that is recoverable or not, we’ll find out.”
- Tractor Supply ($19.3B, Specialty Retail): “Relative to the current environment…there’s a lot of dynamics that obviously are flowing through around some of the IEEPA tariffs and how that has put some pressure on the inflationary environment…We’re now shifting and flowing into other potential cost pressures related to fuel, oil, and other inputs. And we’re just monitoring those closely. There’s a lot of uncertainty as we look ahead.”
- Mattel ($4.2B, Consumer Durables & Apparel): “Our guidance related to tariffs includes a range of assumptions and scenarios. Specifically, what we have included in the guidance is the expectation that the actions we’re taking back in 2025 will fully offset the annualized dollar-cost impact of 2026. But you know that the tariff situation is fluid. We started the process of refunds. We’re actively working through the systems. And more broadly, the overall framework is still evolving, including potential appeals. So the timing and ultimately the outcomes are not clear. So that’s why I say that our guidance includes a range of assumptions and tariff rates for the year. But it’s important to say that our guidance does not factor in a refund, given the uncertainty at this point.”
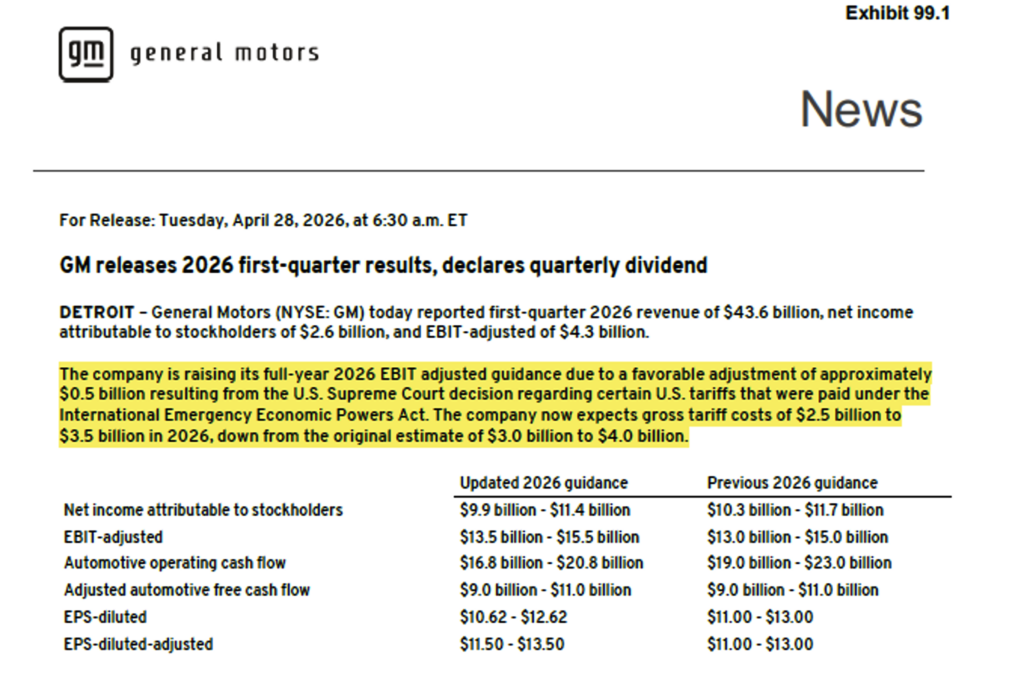
- General Motors ($70.4B, Automobile Manufacturers): “All we’ve done here is taken the IEEPA direct tariff that we paid last year. That was subject to the Supreme Court decision and credited back as a receivable. And as we said, we haven’t changed our FCF guidance because we don’t know when the refunds will be received or how that window might work going forward. Now, keep in mind that most of our tariff burden comes from Section 232. So IEEPA versus our size is relatively small. But because of that entry, we took it. We took the [tariff bill] guidance down. We’re not projecting any other changes to our tariff bill.”
- O’Reilly Automotive: ($83.7B, Specialty Retail): “The changes within the tariff environment did not materially impact our Q1 gross margins, as our net tariff exposure has remained relatively stable. Additionally, at this point, neither our Q1 results nor our outlook includes any benefit from tariff refunds. We actively monitor these topics as they develop and are being proactive to ensure our sourcing is competitive and reflects the scale of our company.”
Expense Management
Companies Favoring Cost Management Rather than Broad-Based Consumer Pass-Through to Minimize Consumer Impact
- Royal Caribbean ($71.7B, Hotels, Restaurants, and Leisure): “For the full year, net cruise costs, excluding fuel, are expected to be approximately flat or 50 bps better than our prior guidance, reflecting ongoing efficiency improvements and prudent cost management without impacting the guest experience. While we manage our costs more on an annual basis, the cadence of our cost growth varies throughout the year.”
- Wayfair ($10.3B, Specialty Retail): “We have heard many questions for investors regarding the impact of higher energy and fuel costs. Our platform puts us in a strategically valuable position here. While we face higher fulfillment costs, they are reflected in the final retail price through the take rate. Suppliers ultimately decide the level of cost burden they’re willing to bear, as they determine the wholesale price they want to charge for each item. Ultimately, we see that suppliers are focused on remaining competitive, especially in such a demand-constrained period, and so prices remain generally stable.”
- Sprouts Farmers Market ($6.9B, Consumer Staples Distribution & Retail): “From an inflation perspective, similar to where we’ve been, the last couple of times, we’re typically on a like-for-like SKU basis at or maybe a touch higher than CPI, based on our mix. And we’re seeing a pretty steady basket when you put all things together.”
- Philip Morris ($255.9B, Tobacco): “In International Combustibles, while volumes declined by 5.1%, organic net revenues grew by plus 1% and gross profit increased by plus 3.9%, with strong pricing and effective cost management outweighing volume mix headwinds.”
- Coca-Cola ($329.8B, Beverages): “We have a playbook that we’ve had to use now for quite a few years on a range of disruptions…I would describe [our playbooks] at the cost management level. And yet, each market is different. And so, the way that we use these various levers will vary by market. And we have confidence that the decision-making at the local level will allow us to navigate as well as we can through this.”
AI & Digital Acceleration
AI Adoption is Becoming More Practical, Enterprise-Wide, and Commercially Relevant; Companies Lean on Demand Improvement and Customer Engagement
- Hilton Worldwide ($73.5B, Hotels, Restaurants & Leisure): “As we advance our strategy, we’re leveraging AI to embrace the new ways customers are discovering and engaging with our brands, working with leading partners including Google, ChatGPT, and Anthropic, all while remaining focused on strengthening direct, loyalty-driven relationships and maintaining discipline and how we manage distribution. Building on this, earlier this quarter, we deployed an Anthropic-powered platform, called the Hilton AI Planner…which should drive incremental demand across our portfolio.”
- Meritage Homes Corp ($4.6B, Household Durables): “We’re finding ways for AI and technology to interpret documents and auto-feed a lot of data into our systems, which should help us gain efficiencies, and it’s part of the path for us on getting to that 9.5% SG&A target in the future. Obviously, those numbers become even more meaningful at higher volumes. It would have required more man-hours to do some of those tasks. So, it helps you not just with costs but also with accuracy and rework.”
- General Motors ($70.4B, Automobiles): “The continued growth of this ecosystem, including the customer base, miles traveled, and the insights we’re gaining to train our AI models, will help pave the way for our eyes-off, hands-off technology launching in 2028 on the Cadillac Escalade IQ. The Escalade IQ is just the start. We are doing something unique in the autonomous space: developing a system for personal vehicles that we can deploy on both ICE and EVs and scale across multiple brands and price points. We’re stress-testing it in a digital environment that can simulate roughly 100 years of human driving every single day. The way we’re building this technology reflects how seriously we’re embracing AI across the enterprise. Today, nearly 90% of the code written by our autonomy team is generated by AI.”
- Yum Brands ($44.3B, Hotels, Restaurants & Leisure): “In Q1, Taco Bell US piloted AI-driven A/B testing in the drive-thru, with plans to roll out the technology nationwide this year. This new feature can dynamically change the layout, content, and visuals on a car-by-car basis, allowing the brand to generate insights more quickly and make more effective national adjustments. Whether it is a voice AI in the drive-thru or AI-driven dynamic menu boards, the seamless rollout of these new tech features has been made possible due to the physical and digital assets we have developed and deployed over the years. Similar AI-driven enhancements will be tested and scaled across our brands to drive loyalty adoption and growth. Beyond consumer-facing technologies, Yum! is also uniquely positioned to capture efficiency improvements from AI that will accelerate productivity within our enterprise.”
Tariff Spotlight
Key Focus Areas, Q&A Themes, and Guidance
In reviewing earnings communications this quarter, as of April 29, we have identified 25+ U.S.-based companies explicitly discussing tariffs and tariff refunds in substantial detail, above and beyond generic trade policy risk factors / comments, of which ~68% have provided quantified financial impacts with dollar figures, margin/revenue impact, or EPS effects.
- Given that the U.S. Customs and Border Protection (CBP) portal only launched on April 20, there have been few confirmed instances of companies reporting receipt of IEEPA tariff refunds, while the CBP has stated that companies should expect to receive funds 60-90 days after the refund claim is approved
- A few examples citing inclusion of one-time IEEPA tariff benefits:
- Ford ($48.5B, Automobiles): “Net income of $2.5 billion and adjusted EBIT of $3.5 billion reflect a $1.3 billion one-time IEEPA tariff benefit, strong product mix and net pricing, and growth in software and physical services.”
- General Motors ($70.4B, Automobiles): North America EBIT-adj. margin of 10.1%, including 1.5ppt benefit from the tariff adjustment; recognized $0.5B adjustment in Q1 related to 2025 IEEPA tariff costs; on track to achieve the targeted 8-10% full-year North America margin range.
- Roper Technologies ($36.3B, Automobiles): Reported and adjusted EPS include a $0.19 benefit from recoverable IEEPA tariffs, offset by a ($0.06) impact from a taxing authority matter in Latin America and a ($0.06) headwind related to ongoing conflict in the Middle East.
- A few examples citing inclusion of one-time IEEPA tariff benefits:
- Overwhelming majority of companies mention tariffs as a risk factor in disclosures: explicit mention of tariffs as a risk factor in Safe Harbor Statements has emerged as common practice, with many tariff-exposed companies now discussing the IEEPA reversal in the Notes section of their 10Q
- Companies that discussed tariffs via company communication materials (i.e., earnings press releases, investor decks, and prepared remarks) provided high-level quantified impacts to results, whereas Q&A was reserved for providing additional detail on forward-looking statements
Select examples include:
General Motors ($70.4B, Automobiles): Announces tariff adjustment and impact to FY’26 guidance in press release
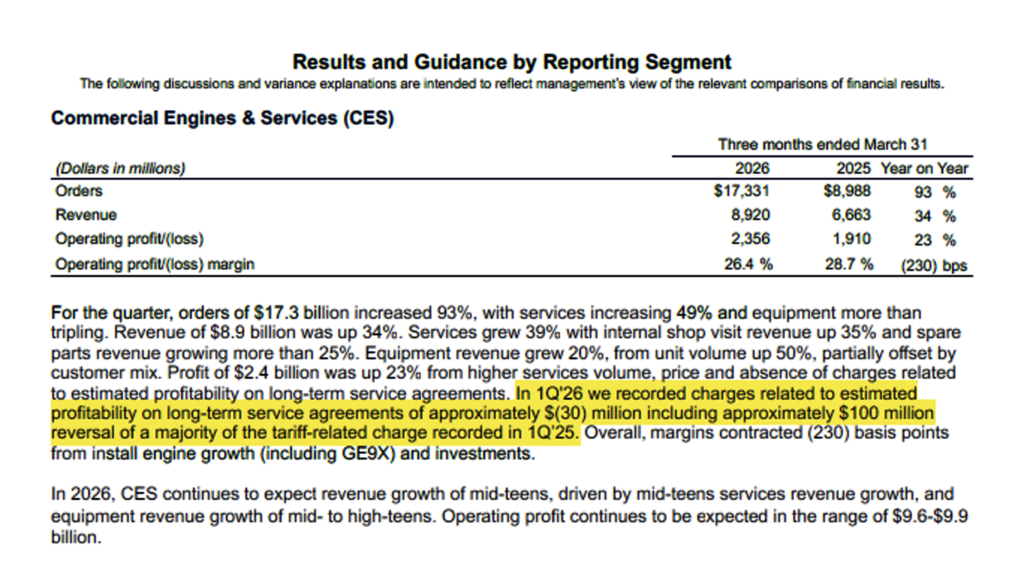
GE Aerospace ($296.9B, Aerospace & Defense): Notes the impact of tariff reversal for segment-level quarterly results
In Closing
Overall, commentary on consumer sector management reinforced a widening K. Consumer Discretionary companies operate in a more demand-sensitive environment in which affordability, financing costs, and fuel prices directly influence consumer behavior. Conversely, Consumer Staples companies have been relative beneficiaries of recurring consumption and broad product portfolios.
As we look ahead, we will be watching for Top-of-the-K Consumer Discretionary companies to demonstrate a willingness and ability to spend on non-necessity goods, contextualize demand elasticity and sensitivity to macro pressures, and articulate proactive mitigation strategies. Meanwhile, focus will be on Consumer Staples companies to deliver on brand power, affordability, and perceived value, sustaining volume and margin performance.
We hope you find our coverage of the tip-of-the-spear Consumer Sector helpful as we seek to connect the dots on the impacts on the broader macro, which are unfolding in real time amid continued curveball uncertainty.
Up next week: Materials Sector Beat