
Closing the Quarter – Q2’25
In today’s thought leadership, we cover:
- Key Events this week
- Closing the Quarter Summary – Q2’25 earnings performance, guidance moves and consensus shifts, tariff and trade policy updates, OBBBA impacts, and capital allocation
Key Events
Geopolitics / Trade Negotiations
- The U.S. and China on Monday agreed to extend their tariff truce for another 90 days, one day before it was set to expire. President Trump announced that he signed an executive order suspending the imposition of higher tariffs until November 10, with all other elements of the truce to remain in place. China’s Commerce Ministry issued a parallel pause on extra tariffs early on Tuesday, also postponing for 90 days the addition of U.S. firms it had targeted in April. (Source: Reuters)
- President Trump and Russian President Vladimir Putin are set to meet in Alaska on Friday with the leaders expected to bring divergent priorities to their talks about ending the war in Ukraine. Trump told Ukrainian President Zelensky on Wednesday that his goal is to get a ceasefire to better understand if a full peace deal is possible. Meanwhile, Putin has been consistent in his desire to win Ukrainian territory. (Source: Reuters, BBC)
Inflation
- The U.S. consumer price index rose a seasonally adjusted 0.2% MoM in July, in line with consensus and down from June’s 0.3% increase. The annualized rate of headline inflation held steady at 2.7%, a bit cooler than consensus estimates for a 2.8% increase. Core CPI (excluding food and energy) rose 0.3% MoM, also in line with consensus, though annualized core CPI was up 3.1%, a touch hotter than consensus for 3.0%, representing the highest YoY increase since February. (Source: Labor Department)
- The U.S. producer prices index rose 0.9% MoM in July after being unchanged in June, coming in well above consensus for a 0.2% increase and marking the steepest rise in prices since June 2022. On an annualized basis, the PPI was up 3.3%, jumping higher from June’s 2.4% reading. (Source: Labor Department)
Retail Sales
- U.S. retail sales rose a modest 0.5% MoM in July, in line with consensus, while June’s reading was revised higher to 0.9% from the 0.6% gain initially reported. Control group sales, which strips out volatile segments and feeds into GDP, also advanced 0.5% MoM, slightly ahead of economist forecasts for a 0.4% gain. (Source: Commerce Department)
Labor Market
- U.S. initial jobless claims dropped by 3,000 to a seasonally adjusted 224,000 for the week ended August 9, better than economist forecasts for 228,000 claims. Continuing claims for people receiving benefits declined by 15,000 to 1.953 million for the week ending August 2, However, continuing claims remain near their highest levels since the fall of 2021, aligning with consumers’ rising perceptions that jobs are hard to find. (Source: Labor Department, Reuters)
Closing the Quarter Summary
Heading into earnings season, our Q2’25 Inside the Buy-Side® Earnings Primer® survey, published July 10, revealed a positive shift toward cautious optimism with bullish sentiment rebounding from Q1’s record pullback, though not yet fully back to late-2024 ‘Trump Bump’ highs. Further, with executives credited for effectively managing Street expectations, nearly 80% of participants anticipated Q2 results to meet or beat consensus estimates. At the same time, recession fears eased alongside less downbeat views on 2025 GDP, albeit with nearly half still projecting slower growth YoY and nearly 75% expecting the U.S. employment picture to worsen.
Tariffs remained the leading hot topic to address on earnings calls, particularly their knock-on effects on demand and pricing, while consumer health also moved to the fore. Against this backdrop, our survey found investors evenly split on whether they were prioritizing growth or margins, reflecting the complex setup for stocks heading into this earnings season.
With Q2’25 earnings largely in the books, we “Close the Quarter” with some notable themes:
1. Q2'25 Earnings Performance
Big Surprises to the Upside (Relative to Reset Consensus), with EPS and Revenue Growth Above 5-Year Averages; Steady, but Slower Growth Projected Ahead
Overall, Q2 prints fared much better than expected, albeit against consensus estimates that were meaningfully lowered amid Q1’s tariff-dominated narratives and caution.
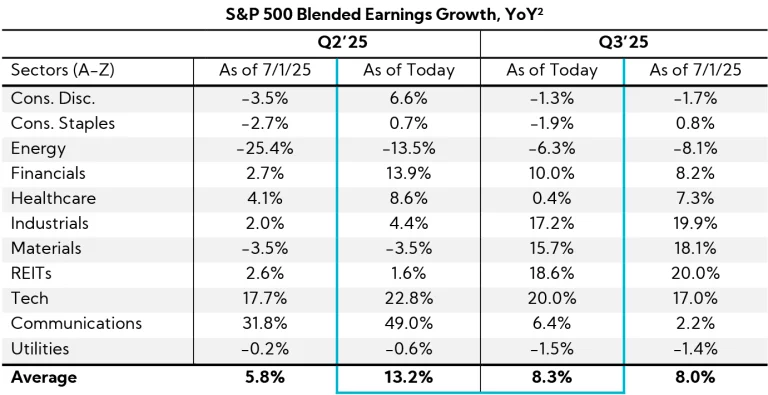
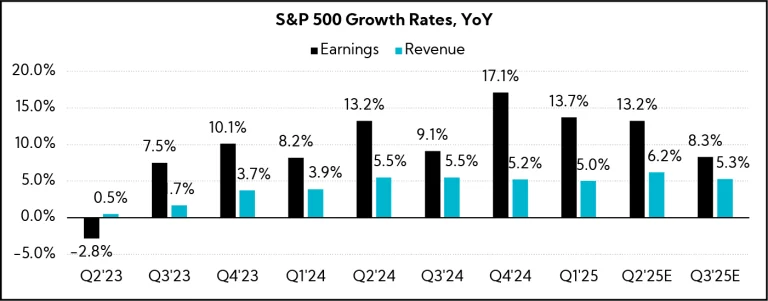
With over 90% of S&P 500 companies reporting earnings to date, the Index shows YoY blended1 earnings growth of 13.2%, more than double the 5.8% estimated at the start of July (which had come down from 10.2% estimated on April 1). Notably, 80% reported a positive EPS surprise, above the 5-year average of 78%.
Further, in contrast with last quarter’s trend, forward estimates for Q3 in aggregate have held up well, even edging up slightly to 8.3% from 8.0% observed at the start of July. However, this still represents a significant step-down from Q2 levels. Communications, Tech, Financials, and Energy have seen the largest positive revisions, while Healthcare, Staples, Industrials, and Materials stand out among those having estimates lowered.
As for revenue, the YoY blended growth rate stands at 6.2%, up from 3.2% estimated at the start of July (which had come down from 4.3% estimated on April 1). Notably, 79% reported positive top-line surprises, well above the 5-year average of %, with prints 2.8% above consensus estimates, also ahead of the 5-year average of 2.1%. Looking ahead, Q3’25 S&P 500 estimates are calling for 5.3% blended top-line growth, down from the Q2’25 rate of 6.2%.
2. Guidance Moves and Consensus Shifts
After a Solid 1H, a Slight Majority Raise 2025 Guides for Both Revenue and EPS; Tech, Healthcare, Communications, Industrials, and Energy See the Most Broad-based Upward Revisions across Revenue and EPS Consensus Estimates, While Materials Stands Out as the Only Sector with More Decreases than Increases for Both Metrics
Guidance Moves
We analyzed annual revenue and EPS guidance trends across the S&P 500.3 Below are our findings.4
Overall, annual revenue and EPS guides reflect an optimistic stance toward the year ahead relative to the more cautious approach seen last quarter. More than half (55%) Raised guidance while 28% Maintained. EPS saw a similar trend with the majority of companies (55%) Raising guides, while 31% Maintained.
Revenue
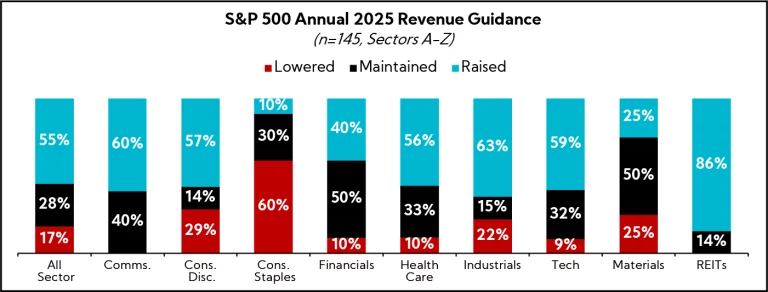
The majority of companies, 55%, Raised the midpoint relative to last quarter, while 28% Maintained, and 17% Lowered; average spreads were narrowed 70to a range of 1.7%
- 89% of companies expect full-year 2025 results to be above 2024 actuals
- 45% of companies are forecasting annual Revenue guides above while the remaining 55% are guiding below
- Among those that raised Revenue guidance, REITs stand out for its large share of increases (86%)
- Conversely, Consumer Staples saw only 10% of companies increase Revenue guidance, while 60% lowered
EPS
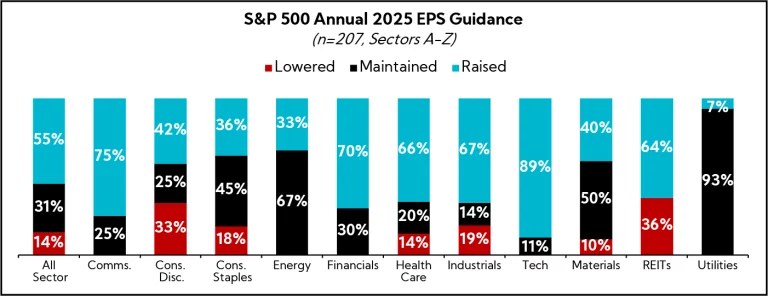
The majority of companies, 55%, Raised the midpoint relative to last quarter, while 31% Maintained and 14% Lowered; average EPS spreads decreased from $0.35 to $0.27 on EPS of
- 85% of companies expect full-year 2025 results to be above 2024 actuals
- 56% of companies are forecasting annual EPS guides above consensus
- Among the 55% that raised EPS guidance, Tech stands out for its large share of increases (89%), while Consumer Staples and Materials again stand out negatively
Historical Adjustments to Annual Guidance in Q2
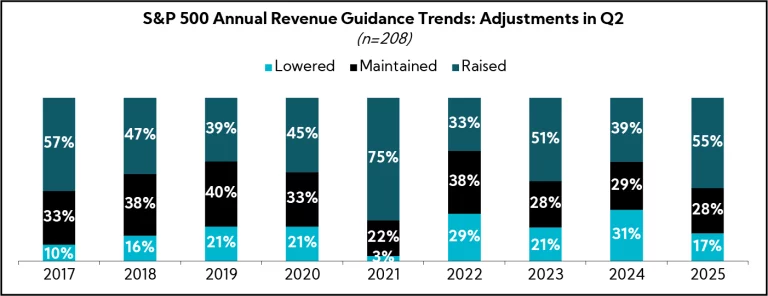
Looking at historical trends for the second quarter reporting season across the S&P 500, Q2’25 stands out for the relative optimism conveyed by executives versus Q2’24. Indeed, with two quarters in the books, companies are raising revenue and EPS guidance at the highest rate since Q2’21.
Revenue
- Raises Above Historical Levels: Revenue outlook Raises captured in Q2’25 are at 55%, up from 39% in 2024 and the highest rate since 2021 when 75% raised
- Stable Percentage of Companies Maintaining Guidance: Companies Maintaining their revenue outlooks continue to hover at 28%, in line with 29% in 2024 and 28% in 2023
- Fewer Lowering Guidance: Only 17% Lowered guidance, reflecting the solid Q2’25 reporting season
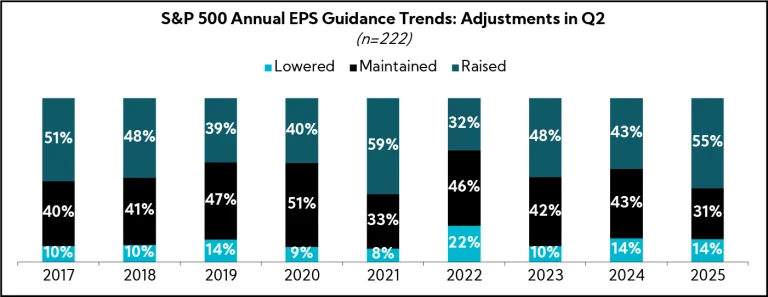
EPS
- More Raised in 2025: 55% of companies have Raised their annual EPS outlook in Q2’25, up from 43% in 2024 and 48% in 2023; this represents the highest level observed since 2021
- Fewer Maintained: 31% of companies Maintained guidance, down from 43% last year
- Unchanged Percentage of Lowered Guidance: 14% of companies lowered their outlook, in line with 2024
Consensus Shifts
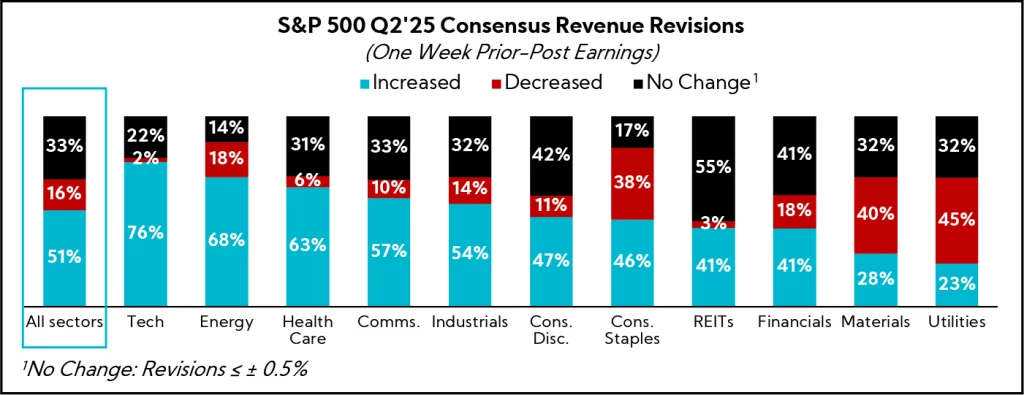
When reviewing full-year 2025 consensus changes for the S&P 500 from one week before through one week after Q2’25 earnings announcements, analyst revisions show a positive picture, with a majority of increases for both EPS and revenue. Still, trends vary widely by sector.
Looking at revenue, 51% of companies saw estimates increased, 16% decreased, and 33% maintained. Upward revisions were most prominent for Tech, Energy, and Healthcare, which saw estimates raised for 76%, 68%, and 63%, respectively. Utilities, Materials, and Consumer Staples, however, saw the largest rate of decreased estimates: 45%, 40%, and 38%, respectively.
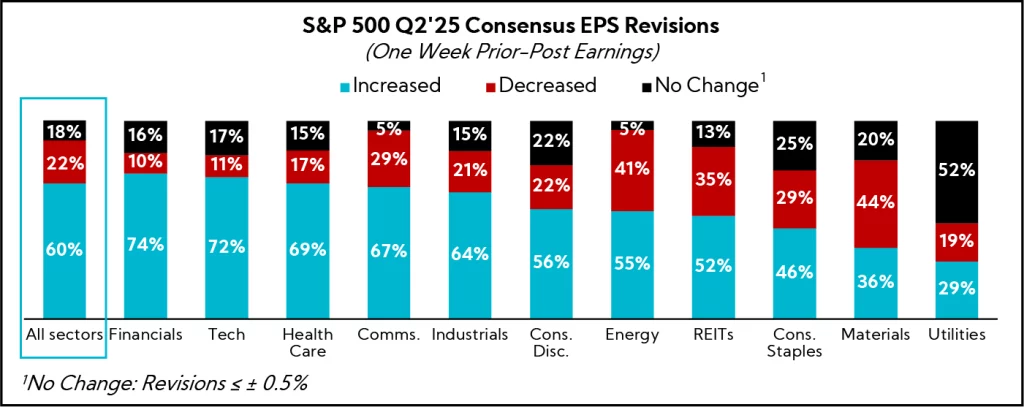
For EPS, 60% of the S&P 500 companies saw full-year estimates raised, compared with 22% decreased, and 18% maintained. Upward revisions were concentrated more heavily towards Financials, Tech, Healthcare, Communications, and Industrials. Meanwhile, Materials, Energy, REITs, and Consumer Staples saw the largest share of decreased estimates. Notably, only Materials saw more EPS estimates decreased than increased.
Combining both metrics, Tech, Healthcare, Communications, Industrials, and Energy stood out as sectors with more companies seeing increases of over 50% for both revenue and EPS. In contrast, Materials saw a larger proportion of downward revisions across both metrics.
3. Stock Price Reactions
Misses Punished More Than Historically, Including Some That Delivered on the Bottom-line but Fell Short on Top-Line
With the S&P 500 hovering near all-time highs after the sharp rebound off April lows, companies faced a challenging setup this earnings season, with valuations stretched and stocks seemingly priced for . Further, with executives credited for effectively resetting expectations last quarter, consensus estimates had come down meaningfully in the run-up to Q2 earnings. With the bar lowered, companies missing consensus – particularly on EPS – have been penalized far more than usual this quarter.
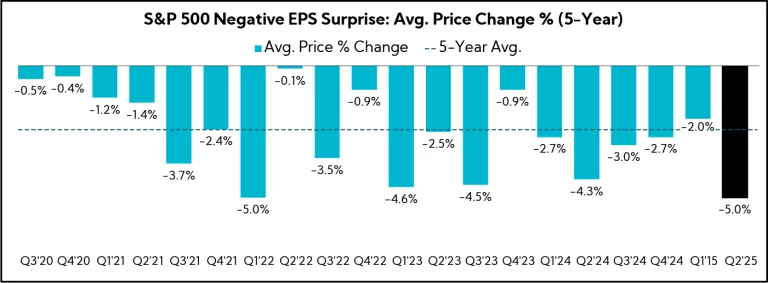
As of August 12, S&P 500 companies reporting negative EPS surprises have seen an average price decline of 5.0% for the period two days before the earnings release through two days after the release, more than double the 5-year average of decline of 2.4%. Conversely, companies that have reported a positive earnings surprise have seen more muted reaction, with an average price increase of 0.2% compared with the 5-year average gain of 1.0%.
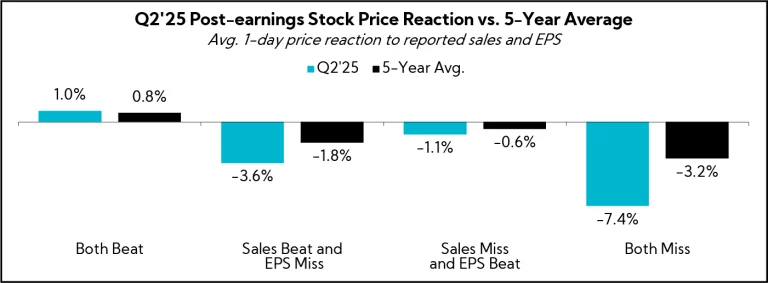
Digging further, companies that beat on one metric while missing on another have also seen their stocks drop more than the historical average. Notably, while those missing on both profit and sales have experienced the most dramatic declines on average, stocks have been punished more for missing profit estimates relative to those that missed only on sales.
4. Tariffs & Trade Policy
Mitigation and Lower‑than‑Feared Tariffs Limit Q2 Impact; Execs Note Margin and Demand Headwinds Set to Build in 2H
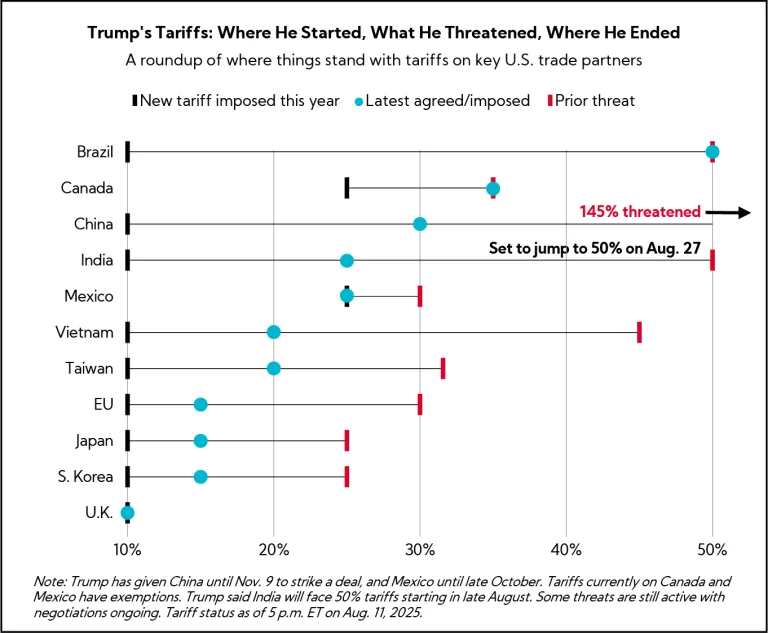
While tariff rates have been settling in below the extreme levels threatened by the Trump Administration in early April, it is worth highlighting that current tariffs on major U.S. trade partners still represent a sharp increase, with higher costs likely to be shared by corporations, suppliers, and end customers / consumers.
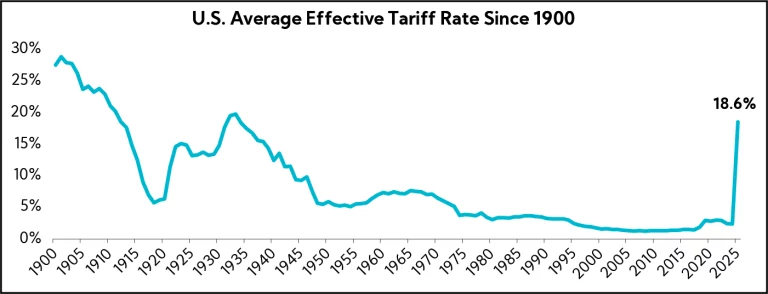
Indeed, the latest update from Yale’s Budget Lab estimates an overall average effective U.S. tariff rate of 18.6%, the highest level since 1933, and up from 2.4% at the start of the year.
With this in mind, our analysis of earnings calls reveals that companies across sectors anticipate the negative impacts from tariffs to show up more meaningfully in the second half. Consumer-facing companies, in particular, have pointed to expectations for pressure on margins along with heightened concerns around the potential negative hit to demand amid already muted consumer sentiment.
Companies across Industrials and Materials have also flagged tariffs as a headwind, noting uneven ordering patterns and volumes, while some, such as Caterpillar and Cummins, highlighted the negative impact from tariffs on Q2 profits.
Selected Tariff Commentary from Earnings Calls
July 22 – General Motors ($50.0B, Automobiles)
“Turning to tariffs, the Q2 net impact of $1.1B was slightly lower than we had expected due to the timing of certain indirect tariff costs. As a result, we will likely see Q3 net tariff costs higher than in Q2.”
July 23 – Hasbro ($10.8B, Leisure Products)
“We haven’t seen any of that tariffs impact in the P&L quite yet. That starts to manifest in the back half of the year, and that’s almost a 2-point drag on our margins as we move through that back half.”
July 31 – Masco ($14.5B, Building Products)
“It’s important to note that we are talking about currently enacted tariffs, so not tariffs that may or are expected to go into effect here in August, but tariffs that are in effect here in July. Our in-year impact of those tariffs is ~$140M and largely in the second half of the year.”
August 5 – Caterpillar ($200.4B, Machinery)
“The net incremental impact from tariffs was around the top end of our estimated $250M to $350M range for Q2. With a decrease in certain tariff rates during the quarter, we lifted some holds on inbound shipments. We expect the net impact from incremental tariffs for 2025 will be at around $1.3B to $1.5B, net of some mitigating actions and cost controls. This assumes higher net incremental tariff impacts in both Q3 and Q4 compared to Q2. Due to the timing of recent rate changes, the headwind is likely to be larger in Q4 when compared to Q3.”
August 7 – Motorola Solutions ($73.7B, Communications Equipment)
“We began seeing the tariff impact in late Q2. Most of that $80M is in front of us in the second half.”
August 7 – Ralph Lauren ($18.4B, Textiles, Apparel & Luxury Goods)
“We remain cautious on the second half of the year due to potential tariff-related pressures on broader consumer behavior. We need to see how consumers respond to the start of the fall holiday season and what will be an uncertain, potentially inflationary environment.”
5. OBBBA
Analysts Probe for Expected Impacts; Execs Cite Bonus Depreciation and R&D Expensing as Key Tailwinds, See Potential to Spur Investment; Full Impacts Still Being Assessed
In the aftermath of President Trump signing the “One Big Beautiful Bill Act” into law on July 4, subsequent earnings calls saw analysts probe for expected impacts of the new legislation. Commentary from executives thus far has largely framed the included tax incentives as a tailwind, with bonus depreciation and R&D expensing expected to provide meaningful cash tax benefits and support future investment. That said, management teams have remained mostly guarded regarding the potential upside, emphasizing they are still evaluating the full impact.
Selected Commentary from Earnings Calls
July 24 – Graco ($13.8B, Machinery)
“Big picture, long-term clarity on tax rates, favorable treatment on investments and related things in manufacturing will over time be a real positive for Graco. Reshoring, onshoring relocation is good for our business.”
July 30 – Penske Automotive Group ($11.8B, Specialty Retail)
“While we continue to evaluate the impact of the One Big Beautiful Bill on our financial statements, we do expect to recognize positive cash flow impacts related to our 28.9% ownership in the PTS partnership. Bonus depreciation, in particular, will provide an estimated benefit of ~$150M and a $3B worth of capex in trucks that PTS expects to purchase in each of the next three years and beyond.”
August 5 – Ball ($14.3B, Containers & Packaging)
“The short answer is we don’t think [OBBBA] is going to change the trajectory much of the effective tax rate and largely the benefits are going to come in through the acceleration of depreciation and ability to deduct more because of the EBITDA limit versus the operating earnings limit. For the most part, we’re still early and really figuring it out, but I don’t think it’s going to be much of a change for us.”
August 6 – Global Payments ($20.8B, Financial Services)
“We expect tax provisions included within the recently passed One Big Beautiful Bill Act to modestly improve our cash flow generation going forward and allow us to increase our capital returns to shareholders to a total of $7.5 billion between 2025 and 2027, consistent with the capital allocation plan we outlined at our Investor Conference last September.”
August 7 – First Advantage ($2.8B, Professional Services)
“It’s still too early to tell… but it’s certainly something we have our eyes on. For now, we’ll take the cash in pocket for 2025. That obviously supports our deleveraging, accelerates that to an extent, and allows us to maybe make a couple more accelerated investments. For now, that’s the primary impact for us.”
6. Capital Allocation
Cash Deployment Trends Reveal a Shift toward Capex and M&A in Q2 as Buybacks and Dividends see Declines QoQ; All Categories Higher YoY
To garner insights into capital trends, we analyzed the average sector allocations within the S&P 500.5
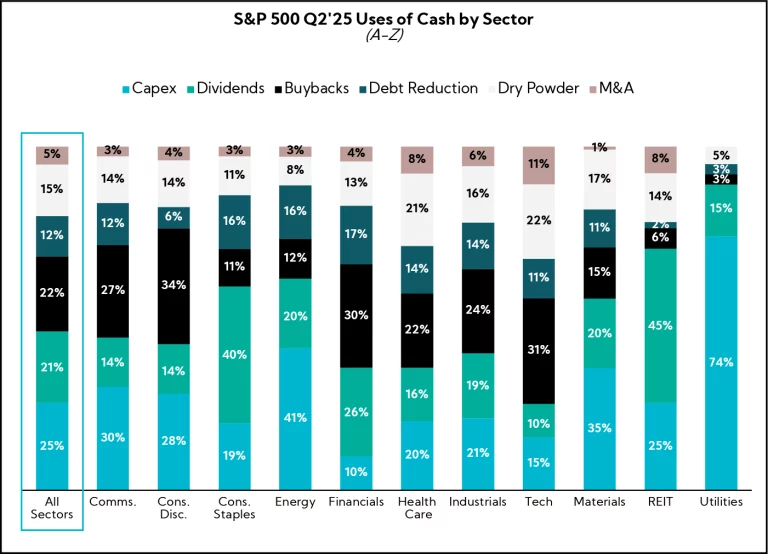
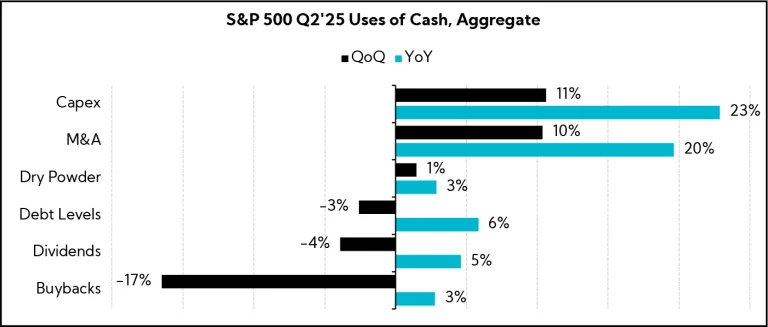
On a QoQ and YoY basis, S&P 500 capex increased 11% and 23%, respectively, marking the strongest gain across capital allocation categories. Buyback growth declined 17% QoQ but rose 3% YoY, while dividends followed a similar pattern, down 4% QoQ and up 5% YoY.
Dry powder usage edged up 1% QoQ and 3% YoY, while debt levels decreased a modest 3% QoQ but increased 6% YoY.
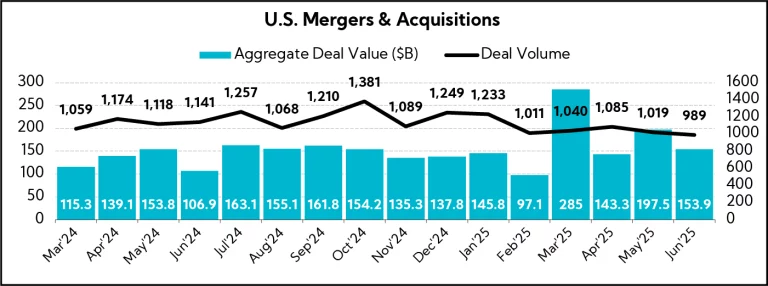
M&A activity was notably higher, increasing 10% QoQ and 20% YoY, reversing the trend observed in the prior two quarters. A closer look at U.S. deal activity shows deal volumes built momentum from February before edging lower in May and June.
Continuing, with the exception of Materials, capex increased across all sectors on a QoQ basis, with the steepest increases observed in Communications (+15%), REITs (+15%), Tech (+14%), and Financials (+12%).
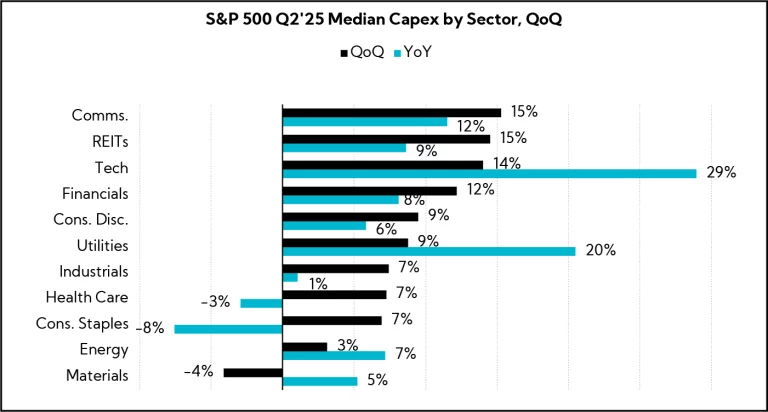
Along with these quarterly increases, YoY trends were broadly positive, with the largest increases being Tech (+29%) and Utilities (+20%). Communications, REITs, Financials, and Energy also posted solid YoY increases, while Consumer Staples and Healthcare were moderately lower.
In Closing
As we wrap up our coverage of Q2’25 earnings season, it’s clear that companies have largely been able to deliver solid results despite ongoing macro uncertainty, in part driven by consensus estimates having been meaningfully lowered following last quarter. While mega-caps and companies benefiting from secular tailwinds, such as AI, defense, and selected infrastructure buildout, have been driving strong earnings growth, companies across industries continue to face a dynamic macro environment punctuated by shifting trade policy, uneven order trends, ramping costs, and apprehension that higher prices could weigh on demand in the second half.
To that end, tariff rates on major U.S. trading partners appear to be settling above levels that prevailed during the 90-day “reciprocal tariff” pause that expired in August, while a trade deal with China has been punted to November. In short, global trade policy remains fluid, and companies will be contending with decisions around supply chain shifts, pricing, and their ability to absorb or pass along higher costs in coming quarters.
Meanwhile, valuations have become increasingly stretched with major indices at all-time highs, even as the broader economy is holding up but not firing on all cylinders, with a cooling labor market and an increasingly price-conscious consumer. In this context, we saw several instances of stocks selling off on signs of slowing top-line growth despite solid Q2 bottom-line performance. It’s too early to call a definitive shift in investor preference toward growth over margins, but we’ll be watching this closely into Q3.
And on the topic of growth…what gets the global economy humming is spending, not cutting. The general across-the-board increases in capex this quarter and year-over-year is notable as is the hunger for expansion from the investment community. Companies prepared to capture the inflection by shifting with clarity from expense management to investment stand to pull ahead.
As always, we remain dedicated to providing timely insights and actionable strategies to help you navigate the ever‑changing and complex environment. Thank you for your continued trust and partnership.
- Combines actual reported results for companies and estimated results for companies yet to report
- Source: LSEG I/B/E/S (Formerly Refinitiv)
- As of 8/12/2025
- Based on company guidance provided at the time of publication; total number of companies differ across revenue and EPS
- As of August 13, 2025; “All Sectors” figures are equal weighted sector averages