
This Week in Earnings – Q2'25
Industrials Sector Beat
Our thought leadership this week addresses:
- Key Events this week
- Earnings Snap, covering the S&P 500 stats to date
- Selected Insights from our 41st issue of Inside The Buy-Side® Industrial Sentiment Survey®, published this week
- Spotlight on Industrials in The Sector Beat
Key Events
Trade/Tariffs:
- President Donald Trump struck a trade deal with Japan that lowers tariffs on auto imports to 15% and spares Tokyo from punishing new levies on other goods in exchange for a $550 billion package of U.S.-bound investment and loans. As part of the deal, Japan will buy 100 Boeing planes and hike defense spending with U.S. firms to $17 billion annually, from $14 billion. (Source: Reuters)
- A trade agreement between the European Union and U.S. could be imminent, but until a framework is announced, nothing is guaranteed. A 15% baseline tariff rate, which includes an around 4.8% duty currently in place, is currently the base-case scenario for EU imports to the U.S. Negotiations between the U.S. and EU have been tough going with pressure mounting ahead of the Aug. 1 deadline which would see imports from the EU to the U.S. hit with a 30% tariff. (Source: CNBC)
- President Donald Trump suggested that he would not go below 15% as he sets so-called reciprocal tariff rates ahead of an Aug. 1 deadline, an indication that the floor for the increased levies was rising. (Source: Bloomberg)
Jobless Claims
- Initial claims decreased by 4,000 to 217,000 in the week ended July 19, still the lowest since mid-April. That marked the longest stretch of declines since 2022. Continuing claims were little changed at 1.96 million in the previous week. (Source: Labor Department)
Monetary Policy
- The European Central Bank paused its most aggressive interest-rate cutting campaign since the global financial crisis as it awaits clarity on President Trump’s tariffs. The central bank left its key deposit rate at 2% on Thursday, after eight interest-rate reductions since June 2024. (Source: WSJ)
Retail Sales
- Canada’s economy showed signs of strengthening as summer began, with estimated retail sales seeing the biggest growth since last year. Retail sales rose an estimated 1.6% in June, a marked rebound from May’s 1.1% decline. (Source: Statistics Canada, WSJ)
S&P 500 Earnings Snap
33% of the S&P 500 has reported earnings to date
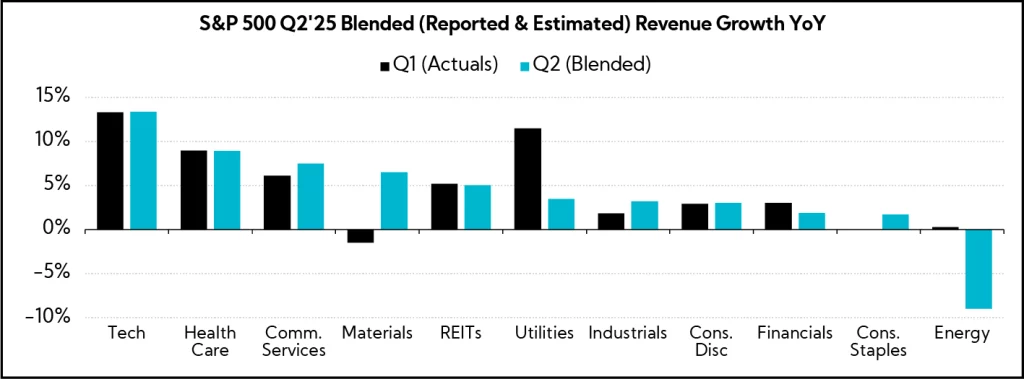
Q2'25 Revenue Performance
- 79% have reported a positive revenue surprise, above both the 1-year average (62%) and 5-year average (70%).
- Blended revenue growth (combines actual reported results for companies and estimated results for companies yet to report) is 4.5%; this compares to Q1’s 5.0% blended revenue growth.
- Companies are reporting revenue 2.3% above consensus estimates, well above the 1-year average (+0.9%) and slightly above the 5-year average (+2.1%).
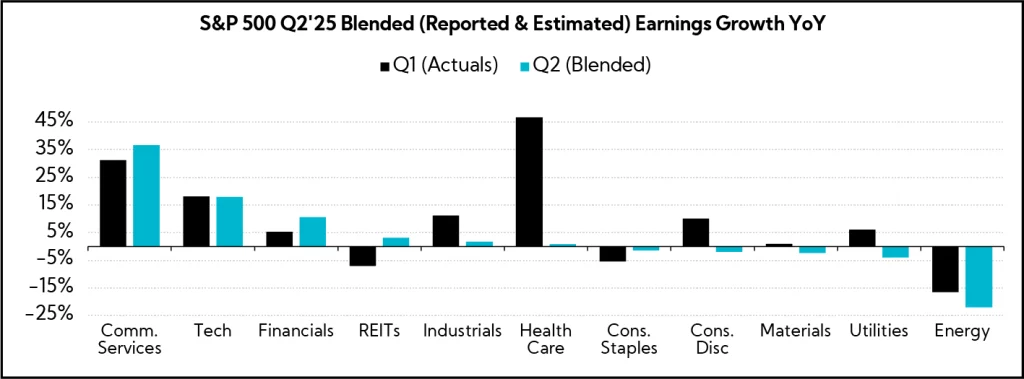
Q2’25 EPS Performance
- 80% have reported a positive EPS surprise, above both the 1-year average (77%) and the 5-year average (78%).
- Blended earnings growth (combines actual reported results for companies and estimated results for companies yet to report) is 7.7%; excluding the Energy sector, the earnings growth estimate is 9.5%. This compares to Q1’s 13.7% blended earnings growth.
- Companies are reporting earnings 6.8% above consensus estimates, above the 1-year average (+6.3%) and below the 5-year average (+9.1%)
Select Insights
Following last quarter’s survey, which found investors leaning more bearish amid heightened trade policy uncertainty, a trend that also prompted a shift toward margin preservation over growth, this quarter’s Industrial Sentiment Survey® reveals a rebound in sentiment with investor bullishness back near levels seen at the start of 2025. While expectations for a pick-up in Industrials has emerged, enthusiasm remains somewhat tempered by lingering tariff uncertainty and the potential dampening effects on demand in the second half of 2025.
Insights are based on responses from 25 sector-dedicated participants globally, from June 24 to July 17, 2025, comprising 80% buy side and 20% sell side, and equity assets under management totaling ~$1.3 trillion, including ~$171 billion invested in Industrials.
Investor Sentiment and Perceived Executive Tone Rebound after Rolling Over Last Quarter; Amid Tariff Pauses and Signs of Pull-forward Demand, Most Expect Q2 Results to Meet or Beat Consensus
- 56% of investors characterize sentiment as Bullish or Neutral to Bullish, up from just 22% last quarter, while those in the Bearish or Neutral to Bearish camp falls below 20% threshold from 44% QoQ
- Similarly, 47% describe executive tone as Bullish or Neutral to Bullish, up from 25% QoQ, while those hearing commentary as Bearish or Neutral to Bearish falls to 21% from 35%
- 45% expect Q2 earnings to be Better Than consensus, up from just 7% last quarter, while an equal number, 45%, anticipate In Line results, compared with 73% in the prior quarter
- Revenue is expected to Improve while barbell sentiment is captured on EPS, with views split on whether results will Improve or Worsen; margins are seen as challenged and FCF is anticipated to be a bright spot
- Most anticipate companies will Maintain annual Revenue and EPS guides, though expectations for both Raises and Lowers see an uptick
Underlying Commentary Indicates Investors are at a Crossroads: While They See Light at the End of the Tunnel for an Industrial Pick-up and Potential Multi-year Capex Cycle, Margin Focus Remains in Favor Amid a Potential 2H “Air Pocket” and Continued Uncertainties
- 50% anticipate Stable 2025 Industrial organic growth, up from 15% last quarter, while just 7% expect growth to contract, down from 39% observed last quarter
- Majority believe tariffs will be a net negative for full-year 2025 growth, profitability, and investment/capex
- Report evidence that pull-forward volumes extended into June and July, creating the potential for order gaps in 2H’25
- Investors continue to prioritize margins versus growth, 62% to 38%, down only slightly from last quarter’s split of 64% to 36%, which was the largest disparity since tracking began in Dec. ’23
- Tariff and policy uncertainty, coupled with questions on pricing power and the consumer, lead some to highlight the potential “dampening effect” on global capex and stretched industrial valuations
- Tariffs and Growth/Demand remain the leading topics to address on upcoming earnings calls, while focus on Margins and Pricing nearly doubles QoQ
Reflecting Cross-currents, Capital Preferences are Split between Debt Paydown and Reinvestment as the Top Uses; Sector Sentiment Is Also Mixed, with Bulls Continuing to Flow into Defense and Shunning Transports and Autos
- Debt Paydown and Reinvestment remain the top two preferred cash uses, each cited by 46%, though support for the former pulls back from a record 69% observed last quarter
- Interest in Share Buybacks jumps to 38%, a survey record, up 15 points QoQ, despite some concerns with stretched valuations
- Support for Dry Powder continues to march higher, rising to 33% from 25% last quarter and 18% prior
- Defense extends its lead as the most favored sub-sector, with bullish sentiment rising to 90%; Ag, Water, and Machinery also see notable upticks in bulls
- Resi- and Non-resi Construction see the largest influx of bears, followed by Paper & Packaging; views toward Transportation and Autos remain deeply negative despite a slight warming QoQ

The Sector Beat: Industrials
Industrial Guidance: Initial Trends
At the beginning of each quarter, we analyze annual revenue and EPS guidance provided by U.S. Industrial companies with market caps greater than $1B that have reported to date. Below are our findings. For comparison purposes, we provide an “All Company” benchmark, which tracks a basket of U.S. companies1 across all sectors that have reported earnings to date (n = 140).2
Guidance Breakdown by Industry
| Industry | Number of Companies |
|---|---|
| Machinery | 9 |
| Aerospace & Defense | 7 |
| Building Products | 4 |
| Industrial Conglomerates | 2 |
| Commercial Services & Supplies | 2 |
| Electrical Equipment | 2 |
| Trading Companies & Distributors | 1 |
| Passenger Airlines | 1 |
| Construction & Engineering | 1 |
| Ground Transportation | 1 |
| Total | 30 |
Source: Corbin Advisors
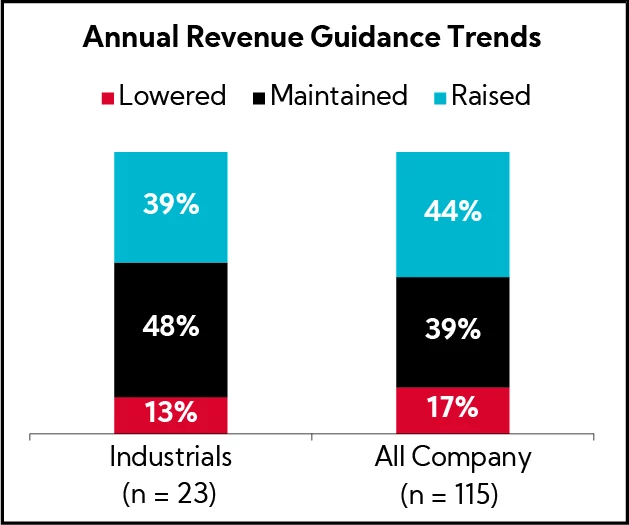
Revenue Guidance
To date, nearly half of Industrials Maintained annual revenue guidance, in line with what the majority of surveyed investors and analysts expected heading into earnings. Notably, triple the percentage of Industrial companies are Raising annual forecasts versus Lowering. That said, the average growth rate for those companies raising guidance is in line with those companies that maintained, at around 3.5%. As of now, 39% of Industrials have raised annual revenue guidance versus just 9% at this point in the earnings cycle last quarter, where we saw nearly three quarters maintaining.
- Companies that Lowered guidance (n = 3)
- 67% lowered the top and bottom of the original range
- Average midpoint of 0.9% growth versus 2.3% last quarter
- Average spread increased by 40 bps to 1.5%
- Companies that Maintained guidance (n = 11)
- Average midpoint of 3.6% growth
- Average spread of 1%
- Companies that Raised guidance (n = 9)
- Average midpoint of 3.5% growth versus 1.9% last quarter
- Average spread decreased by 10 bps to 1.3%
- Overall midpoints assume 3.2% annual growth vs. 3.2% analyst estimates, on average
Annual Revenue Guidance Summary

* = midpoint stayed the same
ABM, DOV, GE, LHK, R, UAL and WAB do not provide annual revenue guidance
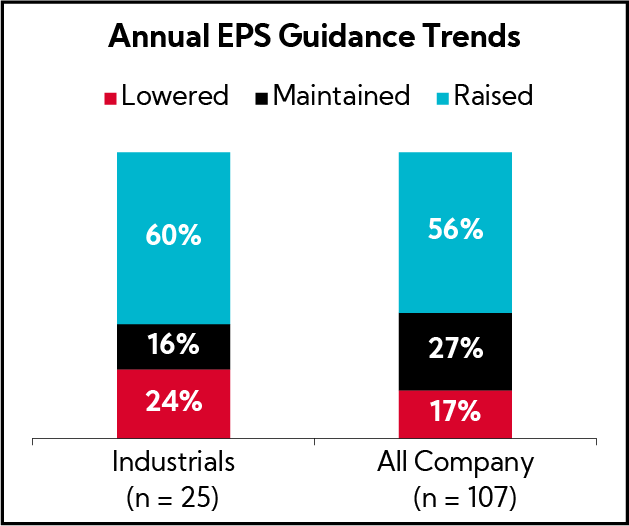
EPS Guidance
The majority of Industrial companies Raised annual EPS guides, in line with the broader All Company benchmark. Still, nearly one-quarter Lowered guides amid macro uncertainty, while 16% Maintained.
- Companies that Lowered guidance (n = 6)
- 83% lowered the top and bottom of the original range
- Average spread decreased from $0.63 to $0.58
- Companies that Maintained guidance (n = 4)
- Average spread of $0.49
- Companies that Raised guidance (n = 15)
- Average spread decreased from $0.47 to $0.43
Annual Adj. EPS Guidance Summary

CNM, EPAC, GBX, GEV and REVG do not provide annual EPS guidance
Industrial Earnings Call Analysis Summary
In addition, we analyzed the earnings calls for this group and the broader Industrial universe to identify key themes.
As Q2 earnings season unfolds, the Industrial sector is navigating a landscape marked by greater stability, but ongoing sluggishness and complexity. While last quarter was defined by tariff-driven volatility and widespread uncertainty, this quarter’s calls reveal a steadier environment and greater confidence in policy direction. While tariffs remain a major focus, management teams point to estimated impacts that have come down significantly from those provided in April (when the U.S. tariff rate on China was 145%) and that mitigation actions are proving effective. That said, while more Industrial companies have raised annual revenue guides following solid 1H performances, views toward the second half remain somewhat cautious, with executives prepared to adapt should trade policy shift again.
The broader demand picture offers mixed signals, owing to the diverse nature of the sector. Defense continues to stand out as a clear bright spot, powered by rising defense spending internationally and a boost in the U.S. from the recently passed reconciliation bill and FY 2026 budget request. Other pockets of strength include Infrastructure and commercial segments benefiting from structural tailwinds (e.g., investment in data center and utilities). Notably, executives largely continue to downplay the impact from pull-forward demand, framing it as isolated to specific end markets or policy changes (e.g., solar tax credits expiring).
On pricing, large multinationals are flexing their pricing power to offset higher costs from tariffs, while many emphasize a flexible approach in response to changing cost pressures and demand dynamics. Globally, the U.S. remains largely resilient, while Europe is showing signs of stabilization, and China remains a challenging market, though some companies are finding pockets of strength.
In wake of the recently passed reconciliation bill in the U.S. (aka OBBBA), we observed a heightened focus on the new legislation’s implications for companies during earnings call Q&A. Analyst questions primarily center on potential benefits or anticipated shifts in order trends. Overall, management teams framed the tax policy changes as positive, particularly the restoration of accelerated R&D and capex depreciation. Some pointed to these provisions already influencing customer conversations and project planning, though most cautioned that the full impact will play out over time. We provide a sampling of OBBBA-related commentary among our key earnings themes.
Overall, the tone this quarter is one of cautious optimism; solid 1H performances and improved policy clarity are supporting more confident outlooks, even as management teams remain vigilant and continue to monitor shifting macro and trade dynamics.
Key Industrial Earnings Themes
Macro & Outlook
Environment Described as Still Sluggish to Stabilizing, While Tariff and Trade Uncertainty Linger
- GE Aerospace ($274.7B, Aerospace & Defense): “Given macroeconomic dynamics, we’re watching demand near term. This quarter, departures grew nearly 4%, in line with our expectations. For 2025, we’re still planning for low-single digit departures growth, taking a more conservative view on the second half.”
- Honeywell ($153.9B, Industrial Conglomerates): “Our first half outperformance has given us confidence to increase our outlook for the year, even as we remain cautious regarding the lagging effect on business demand from tariffs announced in recent months.”
- Lockheed Martin ($97.9B, Aerospace & Defense): “With solid year-to-date growth and expectations for continued ramps in 2H’25, we are reaffirming our sales guidance. On a related note, we have line of sight to increase backlog in 2025 with a handful of significant awards expected in the second half, providing a solid foundation for sustained future growth.”
- 3M ($80.5B, Industrial Conglomerates): “Slide 4 highlights several of the key macro trends we’re tracking and their impact on 3M. All key macro metrics reflect a global economy that remains sluggish and moving laterally, not materially improving or worsening. As we navigate these uncertain times, we’re focused on what we control, solving customer problems through innovation excellence, delivering high-quality products on time to customers and driving efficiency and waste elimination.”
- Fastenal ($54.0B, Trading Companies & Distributors): “Sales in Q2 increased by 8.6%, marking our highest growth since early 2023. And when I think about the growth this quarter, market conditions haven’t really helped us and remain sluggish. We did get some lift from price of about 140 to 170 bps. We are encouraged by the easier comparisons, the improved sentiment, and particularly our internal momentum. That said, we have limited visibility and share our customers’ uncertainty over how current trade policy may impact demand over the course of 2025.”
- Otis Worldwide ($39.9B, Machinery): “We now expect net sales of $14.5B to $14.6B, a slight decline from our previous [2025] outlook, driven primarily by a lower outlook for New Equipment sales. In China, market conditions have remained soft as liquidity challenges are causing a slowdown in execution of our backlog. In the U.S., continued uncertainty over global trade policies are causing project delays. Our resilient Service business is relatively insulated from tariffs. This business is our core earnings driver. Looking ahead, we expect our Service organic sales growth to continue to ramp up through the remainder of the year.”
- Delta Air Lines ($36.3B, Passenger Airlines): “The environment has been stable since resetting to a lower growth rate earlier this year. Overall demand for air travel remains similar to last year, with softness largely contained to main cabin, and particularly during off-peak periods. The fundamentals of the U.S. economy are solid. Our core consumer is in good shape and continues to prioritize travel. The upper end of our outlook positions us to deliver earnings for the first nine months of the year that are flat with 2024. While not the growth we are planning for at the start of the year, this would represent solid performance in a very dynamic environment. Reflecting our confidence in the business, we are restoring financial guidance for the full year. “
- Lennox International ($22.0B, Building Products): “Based on our performance so far and the momentum we’re seeing, we are raising both our revenue and EPS guidance. This includes the impact of pre-buy and temporary share gain. When we gave the guide for 2025 at the end of Q1, our view was shaped by a potential impending recession. It was shaped by tariffs potentially leading to a lot of inflation, and that inflation leading to a lot of demand pullback and consumer uncertainty. Things have just become more stable for the U.S. economy since then. That’s primarily the reason for changing our guide – more stable consumer demand, more stable consumer confidence. At the end of the day, there’s a lot of uncertainty that still remains in the market. Normally, we would have narrowed [the EPS guidance] range at this stage. But given the uncertainty, we kept that to be $1.00, and we feel we are appropriately neither conservative nor aggressive.”
- AZZ ($3.3B, Building Products): “The tariff uncertainty continues to make us a little cautious. Since we don’t have backlogs, we’ve got great customer relations and are talking about their future plans and what they’re doing, which is relatively positive going forward. But the fact that there’s still that tariff uncertainty – we’re cautious on the sales side.”
Tariff Impacts & Offsets
Headwinds Less Severe than Q1 Worst-case Scenarios; Execs Highlight Effective Mitigation and Stand Ready to Adapt to Trade Policy Changes
- GE Aerospace ($274.7B, Aerospace & Defense): “As we shared in April, heightened tariffs are resulting in additional costs for us and our supply chain. We are continuing to make progress on our operational plans to reduce the impact. Assuming that reciprocal tariffs are implemented after the current pause, we still expect the net impact of tariffs to be roughly $500M in 2025, which we are offsetting through cost controls and pricing actions.”
- RTX ($209.5B, Aerospace & Defense): “To clarify on the tariff piece, our $500M contemplates the rates that are currently in effect today. We haven’t contemplated something going up on August 1 or anything that might transpire after that. Should rates change, go up, we’ll probably see about a couple of months of that hit the income statement. The rest would sit in inventory at the end of the year. Between the way we’re looking at the year, we’d be able to absorb that. As we sit here today, there’s still a lot to learn over the next couple of months, and we’ll be monitoring that. Of course, we’re working our mitigations to continue to offset any additional headwind that might come.”
- Honeywell ($153.9B, Industrial Conglomerates): “Our proactive, multipronged tariff mitigation efforts have been working as planned. And because of our systemic approach, we are in a position to deliver strong sales profit and cash flow growth in 2025. We remain committed to fully offsetting the effect of these tariffs with a combination of productivity, pricing, and alternative sourcing as we balance protecting both margins and demand.”
- 3M ($80.3B, Industrial Conglomerates): “[Regarding tariff impact], last time, we said it was $0.60 gross. Now, it’s $0.20. The biggest change is really going to be around China. Last quarter, the rate was 125% and 145%. They’ve come down dramatically to 10% and 30%. Things are moving around still, but we included it in the guidance mainly because we’re more than halfway through the year. Of course, we’re watching very carefully what happens in the EU, but from the way we see it today, we know enough about it in terms of the gross and net impact to roll it through into the guidance, which is cleaner for investors. If you look at margins YoY, you’re still seeing the second half margins go up by 110 bps at the midpoint. And that’s after absorbing tariff.”
- Fastenal ($54.4B, Trading Companies & Distributors): “As we move through 2025, we’ve been redirecting more and more product to come directly into Canada where the economics justify it. And the same thing into Mexico. The downside is it is a more expensive supply chain, because when you’re sending them into multiple ports, it is more expensive than it would be to bring it in through the U.S., but it’s less than 25%, 45% or 50%. You make that decision, but you convey that to your customer. Our covenant is to manage your supply chain.”
- Otis Worldwide ($34.9B, Machinery): “We now expect the impact of 2025 tariffs to be roughly half of our expectations in April to a range of $25M to $35M, reflecting more favorable reciprocal tariff rates and our mitigation efforts. Note that this impact is primarily expected in the second half, as the year-to-date impact has been minimal.”
- Lennox International ($23.2B, Building Products): “When we gave our Q1 guidance, we talked about $250M in tariff impact to us. If you were to ask us the same question now, we will say the impact is going to be less than half of that. Our teams have done a really good job of mitigating tariffs by switching suppliers, and some of the tariffs have been changed or lowered. Going forward, there’s lots of uncertainty. We remain concerned about tariffs coming from South Korea. We remain concerned about some of the August 1 tariff deadlines. And we remain concerned about the future of the USMCA exemption. So, we continue to watch out for those.”
- Pentair ($17.0B, Machinery): “In terms of the tariff, we’re thinking about price offsetting the tariffs. If you remember back at the beginning of Q1, we had estimated the tariff impact at roughly $140M in-year, and that was primarily driven by that high China Now, it’s closer to $75M, so roughly a $65M benefit from those lower tariffs.”
- Allegion ($13.3B, Building Products): “If you think about tariffs, when we met on the Q1 call, we originally had an estimate out there of $80M, and we said there would be about a month lag. Overall, tariffs are about half of that, because the trade regulations have changed, so we’ve updated our assumptions to that $40M for 2025.”
Demand and Growth
Mixed to Positive Signals and Diverging End Markets; While Improved Policy Certainty Boosts Select Industries, Broader Demand Remains Uneven … Shoots of Green are Emerging
- GE Aerospace ($274.7B, Aerospace & Defense): “Our robust orders over the last several quarters have increased our commercial services backlog to now over $140B, supporting growth for years to come. Across the commercial sector, we see strong fundamentals. Air traffic growth is expected to outpace global GDP, especially in Asia-Pac and the Middle East. On the defense side, we see solid momentum globally toward modernization and localization. Domestically, we’re pleased the reconciliation package includes funding for key defense propulsion initiatives, with more than $1B for sixth-generation aircraft programs.”
- Honeywell ($153.9B, Industrial Conglomerates): “Business demand has remained resilient in more sectors and geographic regions thus far, but we are well prepared for potential changes ahead in the macro regulatory and geopolitical environment, utilizing a playbook that has served us well over many cycles.”
- 3M ($80.3B, Industrial Conglomerates): “All three business groups delivered positive YoY growth, despite the fluid macro environment. We saw continued momentum across electronics, general industrial and safety end markets, which was partially offset by known softness in auto and automotive aftermarket. Consumer was flattish as sentiment remains cautious. There’s probably a little bit [of pre-buy] hanging out there, but it’s not substantial. Anything that might happen from Q2 into Q1, we see Q3 coming into Q2. I don’t think the pre-buy is an issue. Orders are hanging in there and backlog is hanging in, if not growing a little bit sequentially.”
- Fastenal ($54.4B, Trading Companies & Distributors): “Feedback from the regional leadership continues to reflect sluggish end market demand despite generally favorable outlook. Trade policy continues to create some caution. Notwithstanding this uncertainty, we did not detect any meaningful pre-buying ahead of tariffs.”
- United Airlines ($29.3B, Passenger Airlines): “Recent United and industry sales data confirms a demand environment that has inflected positively in recent weeks due to this less macroeconomic uncertainty. Just as quickly as demand stepped down in early February due to this uncertainty, it appears that demand is now stepping up. Domestic ticket sales are now also showing positive YoY yields, reflecting this improved demand environment for the first time since February.”
- Lennox International ($23.2B, Building Products): “Our team is performing well despite ongoing challenges, including softness in new construction demand, industry refrigerant, canister shortages, customer uncertainty and inflationary pressures. Destocking in Q2 was largely in line with expectations, though we anticipate some spillover into Q3. While residential new construction remains subdued, the Home Comfort Solutions segment continues to perform well. In Building Climate Solutions, factory productivity has improved, helping to mitigate inflationary pressures. Emergency replacement wins have partially offset end markets that have been weaker than we anticipated. We are beginning to see that more homeowners are choosing repair versus replace and trading down, as inflation and government incentives continue to influence some consumer behavior.”
- JB Hunt Transport Services ($14.7B, Ground Transportation): “During the quarter, overall customer demand trended modestly below normal seasonality. As customers adapted to changes in global trade policy, the timing and direction of freight flows were impacted. That said, demand for our intermodal service remained strong. Truckload spot rates remained soft, suggesting the truckload market continues to experience some excess capacity. Every one of our customers is unique, and specifically in how they’ve adjusted to changes in trade policy. Some stayed the course, some paused certain items, some pulled inventory forward. All of them are considering their sourcing strategies, and that makes for a very dynamic forecasting challenge, for them and for us.”
- Knight-Swift ($7.4B, Ground Transportation): “While the import cliff that many anticipated did not prove to be as stark, there was a general softness in freight demand for most of the quarter, especially on the West Coast. We did experience a mild lift in freight opportunities and projects near the end of the quarter, but short of the normal seasonal build in freight volumes we typically see in Q2. We’re still cautious on where the market is going to head in the back half of the year. But I feel like the worst is behind us.”
- Valmont Industries ($7.2B, Construction & Engineering): “With an infrastructure backlog approaching $1.5B, demand for our products continues to outpace current capacity. We’re operating in an unprecedented utility investment cycle.”
- AZZ ($3.3B, Building Products): “Market strength continued in both construction and electrical, driven by continued growth in submarkets, including data centers, electrical transmission and distribution and solar power This was somewhat offset by lower demand in end markets including industrial, particularly agriculture, transportation, appliance and HVAC.”
OBBBA Impact
Return of Bonus Depreciation and R&D Expensing Cited as Tailwinds, with Some Early Signs of Corporate Tax Incentives Renewing Customer Engagement
- Lockheed Martin ($97.9B, Aerospace & Defense): ” As part of the OBBBA, Golden Dome helps incentivize investment in U.S. manufacturing. Seeing where the demand is going to come for Golden Dome, we see our munition, our missile programs being very key to that. We’re getting ready to invest in additional manufacturing capacity. So the timing is very good with the tax act that came through.”
- Northrop Grumman ($81.4B, Aerospace & Defense): “Domestically, investments in Defense are highlighted by the recently enacted reconciliation bill and FY 2026 budget request, which represents a combined 22% increase in procurement and RDT&E over fiscal year 2025.”
- Delta Air Lines ($36.3B, Passenger Airlines): “The recent passage of the reconciliation package creates certainty around tax policy, and with continued progress on trade negotiations, we expect both consumer and corporate confidence to improve in the second half of the year, creating the environment for travel demand to accelerate.”
- United Airlines ($29.4B, Passenger Airlines): “In the past few weeks, the level of uncertainty has declined. The tax situation is settled after the reconciliation bill passed. The geopolitical situation in the Middle East appears to have stabilized. And while tariffs are not yet certain, the market and most businesses have a much better read on how they’ll manage in a narrower range of outcomes. Encouragingly, that higher level of certainty has translated into a meaningful inflection point in demand.”
- AZZ ($3.3B, Building Products): “What we’re seeing and are going to expect to see is that there’ll be a pull-forward of some of these projects, specifically the solar projects. Those will need to, as they look at what’s happened with the BBB and some of the cuts that have happened, those need to get from planning into production within the next 12 months. And then they need to be completed by 2027. We think a lot of the solar projects that are in the pipeline are going to get pulled forward as a result.”
One Big Beautiful Bill Act – Q&A
General Dynamics ($85.3B, Aerospace & Defense)
Question: “On Aerospace, the book-to-bill in the quarter was very good despite the stock market’s perturbations around Liberation Day. Have you seen any uptick in the pipeline since the One Big Beautiful Bill Act was signed into law and reinstated bonus depreciation?”
Answer: “I wouldn’t cite one macroeconomic factor. I think that there were a lot of them here. There wasn’t one in particular from my perspective that drove the demand. Bonus depreciation helps quite a bit. Always has.”
Graco ($14.6B, Machinery)
Question: “Can you provide some more detail on what you’re seeing from customer spending by end market in the industrial segment? And do you expect any changes from some of the incentives with the one Big Beautiful Bill?”
Answer: “I think the latter question is big picture, long-term clarity on tax rates, favorable treatment on investments and related things in manufacturing will over time be a real positive for Graco. Reshoring, onshoring relocation is good for our business.”
PACCAR ($53.1B, Machinery)
Question: ”With the passage of the One Big Beautiful Bill Act and the R&D and capex depreciation/acceleration that a lot of companies will be getting, have customers re-engaged you about the 2026 order season?”
Answer: “Yeah, they’re actually starting to engage us on that as legislation has passed, and it does have benefits to their cash. Their ability to deploy that cash for capital asset purchases like trucks is starting to be part of the conversation, and is part of our optimism for the latter part of the year. It’ll be very positive for us as a company as well, because that R&D expensing, as well as the immediate R&D expensing on the fixed assets, we think will provide cash tax benefits in the $300M to $400M range. So it’s good news for us; good news for our customers.”
Union Pacific ($138B, Ground Transportation)
Question: “Have you looked at the One Big Beautiful Bill and assessed how that might impact the opportunities and cash flow at the company?”
Answer: ”Yes, we have looked at that. Going back and restoring 100% bonus depreciation, obviously, is a benefit. We think for us, it’s probably cash, $250M to $300M incremental on an annual basis. That’s the primary impact. We do make some investment tax credit purchases-those are still available through the bill…the only thing I would add is the administration talking about deregulation, making sure that the businesses have the opportunity to win. Because we do compete against everybody else in the world, it’s really important to us, and I like some of those things that weren’t specifically in the Big Beautiful Bill, but help us to compete better and be able to move our products within the U.S. and internationally.”
United Rentals ($52.2B, Trading Companies & Distributors)
Question: “On the conversation of the One Big Beautiful Bill. Curious to understand what the implications are for your cash flow, as you have your customer confidence index and conversations, are you seeing any step change or difference in behavior of projects, how quickly they might be moving forward, or the appetite to move forward with things on CapEx projects given the OBBBA reform?”
Answer: “We always caution people from confusing correlation and causation, but certainly we’ve seen our customer confidence feedback stay at high levels and probably get fractionally better versus where we would have been in April. And that trend has continued since early July, so we feel really good about it. Our customers, obviously, feel very good about their own prospects. And in terms of what that translates to, time will tell. But all else equal, you would say that some of these tax policies, obviously, should be advantageous to project economics.”
Westinghouse Air Brake Technologies ($36.7B, Machinery)
Question: “How does the One Big Beautiful Bill impact your operations? And more specifically, how does the bonus depreciation part impact your customers?”
Answer: “With regards to the One Big Beautiful Bill, we’re very pleased to have those tax benefits restored that we’ve enjoyed in the past. But if we look at it strictly from an effective tax rate because we had them in the past, we don’t see a big change on that. But certainly, it’s a big change from where we would have been if they would have expired. When we look at the accelerated depreciation, there is two facets to that and certainly we enjoy it on the things that we’re buying here and being able to take that tax benefit upfront. But when we look at our customers, the way we sell our stuff is based on return on investment to them. We sell equipment that makes them more productive, safer and so on. What this does is certainly helps that IRR because they get that benefit of accelerating it and improving the cash flows or the tax benefits that they have. So, that serves to add on to the already good returns that we had in terms of an IRR to them.”
Pricing
Global Leaders Leverage Pricing Power to Offset Tariff Costs, Yet Remain Nimble and Measured to Balance Demand Sensitivity
- GE Aerospace ($274.7B, Aerospace & Defense): “We expect the supply chain environment to remain tight and that drives a higher inflationary environment than we’ve seen in the past. We’re expecting a consistent environment from where we are. We are expecting that pricing will cover inflation. With those inputs coming in more predictably, in a more linear fashion, we’re able to mitigate some of that material price inflation much more effectively.”
- Honeywell ($153.9B, Industrial Conglomerates): “The pricing initiatives have been quite sticky. We have been very thoughtful to build a strategy which protects our earnings but also our volume. It’s a tough balance because you don’t want to raise the price to a point that you destroy demand. And we have been able to execute that with the minor exception of the Aerospace OE, because there’s a lag given the nature of the contract, but across Honeywell, we have been able to execute our pricing quite successfully.”
- 3M ($80.3B, Industrial Conglomerates): “What we’re seeing so far this year is pretty good progress on pricing, and it’s mostly coming out of the industrial businesses. For auto, where it’s a spec-in business, as you win a spec, you tend to have some value built into that. It’s hard to determine how much is price versus the value that’s there. In Consumer, the big box stores, it’s a little bit harder. We are covering our inflation typically with a little bit more [price] because of the tariff impacts coming through.”
- Fastenal ($54.4B, Trading Companies & Distributors): “Supply chains have gotten more expensive and a part of our response over time will be incremental pricing. During Q2, we implemented three separate pricing actions, which aim to contribute 3% to 4% of price by the end of the quarter. Additional pricing actions will be necessary in the second half, depending upon where the deferred tariffs ultimately settle. Our goal would be to stay with it. Time will tell, but that gets more challenging as we get deeper into it and have more of that higher cost inventory coming through.”
- Lennox International ($23.2B, Building Products): ”As noted in Q1, our pricing strategy is designed to flex with input cost trends, which have moderated. In line with this, we now expect cost inflation to increase total costs by 6%, down from our prior estimate of 9%. This improvement is primarily driven by successful tariff mitigation efforts. Net-net, pricing turned out as expected. Tariff costs continue to come through. We did two price increases, one price and one surcharge, that we talked about in Q1. We ended up withdrawing a large portion of that surcharge as some of the tariffs came out lower. We remain focused on making sure we price fairly and competitively in the marketplace.”
Around the World
Surging Defense Budgets Fuel International Growth; U.S. Market Holds Steady, While Europe Stabilizes; China’s Economic Headwinds Persist — With Pockets of Resilience
- GE Aerospace ($274.7B, Aerospace & Defense): “We’re expecting faster growth internationally than in the U.S., largely in response to rising global tensions and the evolving geopolitical landscape. With respect to Europe, but even more broadly, the optimism we have around defense growth is fundamentally within Defense & Systems. Those increased budgets play into our existing footprint very well. Those international contracts tend to be priced a bit better.”
- Honeywell ($153.9B, Industrial Conglomerates): “U.S. remains a leading growth market. But the headwinds we saw a couple of quarters last year on Europe and China have subsided. So, the growth is more normalized across the globe, with the U.S. being the leader.”
- Northrop Grumman ($81.4B, Aerospace & Defense): “The demand acceleration for our products extends outside the U.S. In Q2, our international sales grew by 18% YoY and are up 14% year-to-date. In the Middle East there are several multi-billion-dollar opportunities in integrated air and missile defense, munitions, E-2D, AARGM-ER, and ground-based radars. There is a generational shift in Defense spending that’s underway in Europe. Looking across our portfolio, three of our four sectors have a very strong international pipeline.”
- General Dynamics ($85.3B, Aerospace & Defense): “The growth in Europe is particularly encouragingand is representative of significant potential in that business as defense spending in Europe is poised to accelerate.”
- 3M ($80.3B, Industrial Conglomerates): “By geography, our growth was led by China, up mid-single digits, with strength in industrial adhesives, films and electronics bonding solutions, driven by strong commercial execution that led to share gains. The U.S. was up low-single digits, led by growth in electrical markets and personal safety, partially offset by weakness in auto OEM and aftermarket. Europe was flat with strength in electrical markets and personal safety, partially offset by weakness in transportation safety and auto. We’re hopeful for Europe in the back half. It’s an important market for us. The watch item for us is going to be auto. Other parts of our business are showing some signs of growth.”
- Otis Worldwide ($34.9B, Machinery): “The New Equipment segment remains a headwind due to soft economic conditions in China and the impact of global trade policy in the U.S. And while conditions remain challenging for our New Equipment business in the near term, our U.S. backlog is growing and China orders are expected to stabilize in the coming quarters. In EMEA, New Equipment orders declined low-single-digits, as strength in the Middle East was offset by weaker demand in Europe. Additionally, growth was negatively impacted by timing of project execution in India. However, the backlog in India remains strong.”
- A.O. Smith ($10.1B, Building Products): “In China, we believe the economy remains challenged and we continue to project that our sales in China will decrease 5% to 8% in local currency. While the stimulus programs benefited sales in Tier 1 and 2 cities, where we saw relatively flat sales compared to last year, stimulus programs were inconsistently applied in other regions, particularly in smaller cities. Consumer confidence remains very low in China. The other thing that’s changed is local competitors have gotten much better. So that’s making it a more mature and challenging marketplace.”
In Closing
As we noted in our Inside The Buy-Side® Industrial Sentiment Survey®, published earlier this week, the backdrop heading into Q2 earnings season has markedly improved from the widespread VUCA that permeated investor sentiment in the April/May timeframe. While anticipation grows for an industrial pick-up supported by a pent-up multi-year capex cycle and green shoots are emerging, unbridled enthusiasm is tempered by lingering concerns around tariff impacts and still unsettled global trade policy.
The tone this earnings season is more confident about the future even as headwinds remain. Confidence can support capex, and we will see if Q2 is enough to get the engines firing on all cylinders for the back half strength that has eluded us for several years now. Market psychology is at play and animal spirits are making their way on stage…are we at the beginning of an inflection?
We will continue to highlight developing themes in our ongoing weekly earnings Sector Beat coverage to provide insightful information on the macroeconomic landscape and factors impacting market sentiment.
Up next week: Consumer Discretionary Sector Beat.
- $1B in market cap
- As of 10am ET 7/24/25